Categories
Education Blog

Bonds and Overrides: A Shift to Local Support

During the Great Recession, Arizona shifted from a K-12 funding system primarily supported by the state, to one where local taxpayers provided a larger share of those revenues. The fact that the amounts from all of these local sources vary by school district, sometimes quite significantly, and that charter schools do not have access to many of these sources, makes bonds and overrides problematic for many education stakeholders. This blog post will address bonds and overrides and provide context on the inequities for students as reliance on local funding has increased.

Bonds and overrides are only two of the multiple sources of revenue that fall under the “local” category of school revenue sources. Others include: the local portion of the state equalization formula, small isolated district funding, desegregation funding, adjacent ways, public school tax credits, and any other money raised locally by the district through donations or fees.  Bonds and overrides make up the biggest share of these, second only to the local portion of the equalization formula.

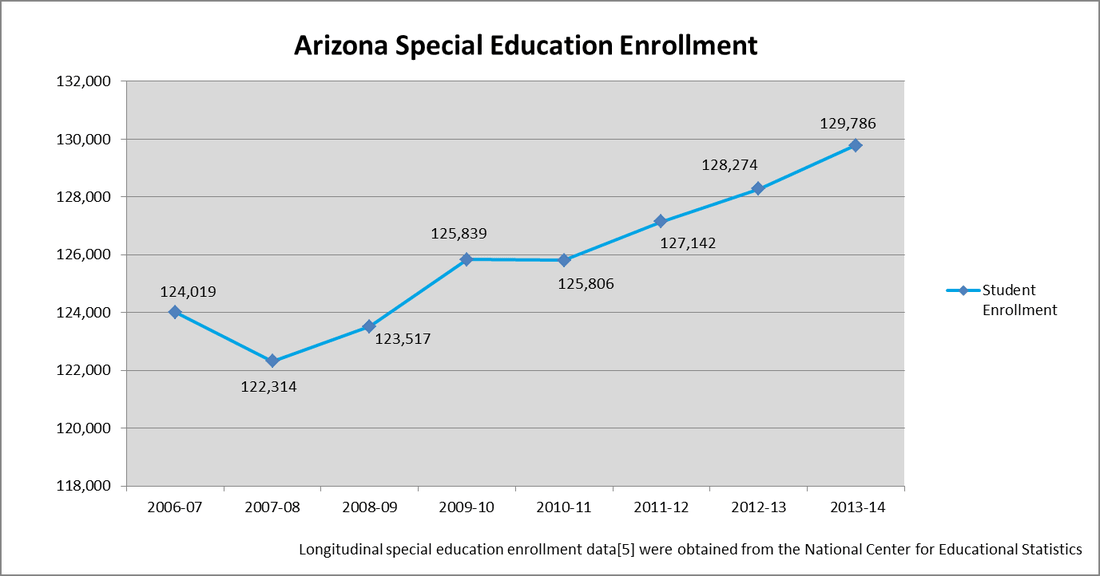
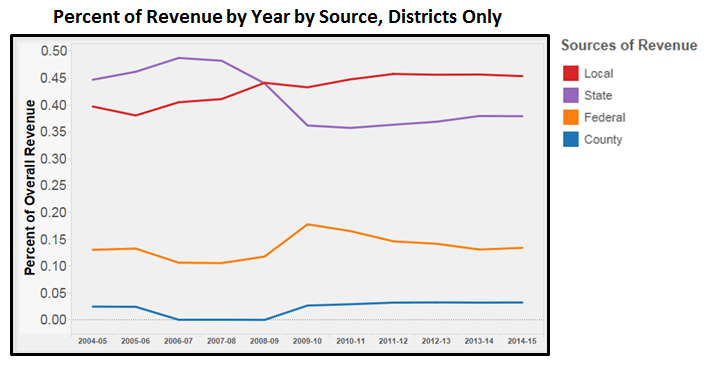
The Arizona Department of Education released in January the Annual Report of the Arizona Superintendent of Public Instruction, Fiscal Year 2015[1]Page six of Volume I offers a ten-year breakout of the sources of revenue for education; below is a graphical representation of that same information (“county” and “intermediate” source categories have been combined for presentation).

The fact that the amounts from all of these local sources vary by school district, sometimes quite significantly, and that charter schools do not have access to many of these sources, makes bonds and overrides problematic for many education stakeholders.  The state has come to rely more heavily on the local school districts to fund a portion of our public education system which poses a challenge to “fixing” the inequalities local funding sources create between communities.

The above graph shows clearly that the 2008-2009 fiscal year represented a shift from a funding system where the state provided the largest share of revenues for districts to one where local taxpayers provided the larger share of those revenues. This was likely precipitated by the Great Recession and the state’s budget shortfalls to follow, but while both the federal and county shares have returned to pre-recession levels, the state/local shift has remained in place.

Bonds

Starting in 1980 and prior to the Students FIRST Act of 1998, schools relied on “Class A” bonds to fund large capital projects such as the construction of new buildings, or the purchasing of school buses or furniture.  Class A bonds required voter approval, because they were accompanied by an increase in property taxes. School districts could ask voters within their district for permission to sell bonds up to a maximum of 15% of the district’s secondary assessed value , and unified school districts could ask for a maximum of 30% of the secondary assessed value[2].

When the Arizona Supreme Court deemed this practice unconstitutional in the 1994 ruling Roosevelt v. Bishop, on the basis that it allowed “property rich” districts to tax at higher rates to produce more financing dollars than their “property poor” counterparts, change was afoot. Lawmakers proposed two possible systems, which were both rejected by the Court, before the Legislature successfully enacted the Court-approved Students FIRST Act of 1998.

Among other things, Students FIRST changed the way that school bonds worked in Arizona. As of December 31, 1998, all future voter-approved bonds were to be known as “Class B” bonds, and carried with them the following restrictions:

  • New, lower, debt limits of 5% of secondary assessed value for school districts and 10% for unified school districts (down from 15% and 30%, respectively)
  • Bond Elections required to be held during a November general election
  • Bonds may not be used to finance “soft capital,” or short-term capital investments such as textbooks (a ban which was permanently lifted in 2009[3])

The legislation also established the School Facilities Board (SFB), which was charged with setting facilities standards for all schools, and overseeing the funds that were distributed to schools to meet these standards. The SFB was (and is) funded by the state General Fund, and the influx of state dollars into district schools’ capital outlay finance equation was the justification for the newly-lowered local debt limits.

The debt limits remained at 5% for elementary and high school districts and 10% for unified districts until 2013, when the limits were raised to 10% and 20%, respectively[4]. Today, school districts are still subject to the 10%/20% debt maximums when considering whether or not to ask voters for bond approval. Bonds may be issued any time within 10 years of voter approval[5].

Overrides

A second form of voter-approved funding comes in what are called overrides. Much like bonds, overrides are financed by a raise in local property taxes, and are also used to fund special purchases and programs that schools would like to implement, but that are not covered by the state-provided budget. Most overrides expire after seven years, with the first five years consisting of full budget override funding, and the final two years acting as “phase out” years. Many school districts return to the voters in year 5 of an override to ask for a renewal, thereby eliminating the phase-out years, to keep funding at full budget levels.

There are three types of overrides: Maintenance and Operations (M&O), Special, and Capital.

  • M&O Override: used to pay for general operations in a school – most commonly used for human capital expenses. This can cover teacher salaries, benefits, newly hired positions, or other everyday purchases such as supplies.
  • Special Overrides: originally created to only fund K-3 special programs, such as full-day kindergarten, after school activities, or special education support. However, in 2009, the K-3 restriction was lifted, and schools are now able to fund any K-12 program with the funds from a special override[6].
  • Capital override: much like bonds, used to fund capital purchases such as textbooks, technology, furniture, or student buses.

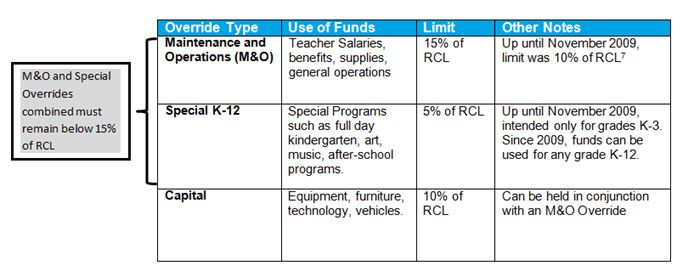
All three types of overrides come with their own sets of restrictions – the limit, which is calculated as a percentage of a school’s revenue control limit (RCL), what the money can be spent on, etc. A district may have all three overrides at one time, though many districts choose to lump the Special Override in with the M&O override, since they cannot exceed 15% combined.

The following table summarizes these attributes:

Conclusion

Although not without drawbacks, bonds and overrides have provided a budgetary pressure valve for the Legislature. Without those two mechanisms and the increased levy ability, the Great Recession would have been far worse for school districts. In reality, some school districts felt the full impact of the budget cuts as many were unable to pass bonds and overrides. Some policy questions include whether reliance on local sources of funding will continue and if so, how will Arizona combat the student and taxpayer inequities?
Footnotes/References

[1] http://www.azed.gov/finance/reports/#SafrTop
[2] Arizona Revised Statute, §15-1021(A)(C)
[3] Laws 2009, 3rd S.S., Ch. 12, §38
[4] Laws 2013, 1st S.S., Ch. 3, §35.
[5] Arizona Revised Statute, §15-1021(E)
[6] Laws 2009, 3rd S.S., Ch. 12, §§ 11-12

[7] Laws 2009, 3rd S.S., Ch. 12, §§ 11-12

Categories
Education Blog

Special Education Student Enrollment Patterns – SPED Series, Part III

In this third installment of our series of special education funding blogs, we sought to better understand the enrollment patterns of special education students across Arizona.  We learned the enrollment of special education students varies widely across counties and within and between districts and charter schools in Arizona, especially when severity of special education disabilities is taken into account.  It is important to note, though, that the Group A portion of the school funding formula (see Blog Part II) assumes a relatively even distribution of special education students across the state. Our research  suggests parents of students with special needs seek out communities (counties or school districts and charters) where services best match their student’s needs.

To understand the enrollment patterns of our special education students, we calculated two indicators that provide insight into the distribution of students with special needs across different public schools, and the severity of their disabilities. The two measures we analyzed are:

Percent Special Education—this is the proportion of students enrolled in the district or charter who are identified as requiring special education services. This measure allows us to compare the concentration of special education students across districts and charters.

  • [special education students] ÷ [total enrollment]

Percent Weighted Special Education—this is the proportion of special education students enrolled in the district or charter, multiplied by the each student’s funding weight. The greater the weight, the more severe the disability. For example, one (1.0) special education student with a weight of 7.947 (multiple disabilities with severe sensory impairment) is equal to a weighted student count of 7.947.  This measure allows us to compare the severity of special education population across schools.

  • Σ[special education students x funding weight] ÷ [total enrollment]

Table 1 below shows the percent of special education students and the percent of weighted special education students for each county in Arizona.

La Paz County’s percent special education is the highest of all counties (16.5%), indicating it has the largest proportion of student identified as needing special services. However, once the severity of the disability categories are taken into account, the percent weighted special education is 9.7%, which places it in the middle of the pack.

The counties with the lowest percent of weighted special education students are also some of the least populated counties in the state: Santa Cruz, Greenlee, Graham, etc. This suggests that families whose special education needs are more intensive seek schools in more populated counties, with larger school districts better positioned to provide services. Maricopa County, the largest county in the state, is also the county with the highest percent of weighted special education students (11.2%).

Table 2 shows the same information for the fifteen largest school districts in the state.

The percent of special education students ranges from 7.6% to 14.9%, showing differences in the concentration of special education students across the largest school districts. When the severity of disabilities is taken into account, the range grows from 6.6% to 15.6%. Tucson Unified and Washington Elementary provide a good example of the shift: they both have 14.9% special education students (the highest of all the big districts), but their percent weighted special education are 11.7% and 13.6% respectively, suggesting that, in general, the needs of the special education population in Washington Elementary are more severe than those of students in Tucson Unified.

Table 3 shows the information for the state’s largest charter organizations.

The percent of special education students ranges from 1.8% to 12.6%. When the severity of disability categories is taken into account, the range widens further: from 1.1% to 15.1%. Overall, the rates of both special education and weighted special education are lower than those of school districts, but the wider range reflects the more specialized approach of some charter schools, including those that set out to serve primarily special education students.

Table 4 shows the information for the fifteen districts and charters with the highest percentages of weighted special education students.

In this case, the percent of special education students ranges from 17.1% to 100%, but once the severity of the disabilities are taken into consideration, the percent of weighted special education students ranges from 33.6% to 543.1%. Arizona Autism Charter School and Sequoia School for the Deaf and Hard of Hearing, part of the EdKey schools in Table 3, enroll only special education students and the corresponding weights of those disabilities result in percent weighted special education numbers well over 500%.

These data, coupled with the nature of charters, suggests that the charter schools on this list have specifically sought to serve special education students. It is unclear, using only these data, whether the same holds for the districts on the list.  Double Adobe, Ash Creek, Yarnell, and Kirkland districts are all small, have a relatively high percent of special education students and when the severity of the disabilities is taken into account, the percent of weighted special education students is even higher.

While our analyses show the enrollment of special education students varies widely, the data suggests that parents of students with special needs seek out communities (counties or school districts and charters) where services best match their student’s needs. Without a relatively even distribution of special education students across Arizona, special education funding must be reviewed and updated, particularly for those districts and charters that are serving a greater proportion of special education and weighted special education students.

This is the third blog in our Special Education Funding series. Click here to read part 1, and click here to read part 2.

Categories
Education Blog

Special Education Simplified – SPED Series, Part II

As Arizona’s K-12 enrollment has grown, including students with disabilities, our school finance formula has stayed relatively unchanged. It has not fully addressed recommendations made in a 2007 special education cost study[1] nor has it kept pace with the 5 percent increase in our special education population, as we found in our first blog. The Association investigated the current funding formula to understand how special education students are funded and how the funding mechanism is impacted by increases in student enrollment  in order to determine whether it serves the needs of our special education students.

Arizona’s school funding formula addresses special education funding using two separate mechanisms. The first funding mechanism, called Group A[2], provides funding for every student in the state, regardless of special education designation. This portion of funding is designated for a particular group of special education students as well as other programs like gifted, career exploration, and remediation programs. Group A funding is distributed to all schools based on the total student enrollment; each student receives an identical weight in the funding calculation. The second funding mechanism, called Group B[3], provides funding according to the most severe special education category identified in students’ Individual Education Plans. The Group B categories and their definitions are presented in the following table:

The Findings

Like the overall system, these two funding mechanisms are directly impacted by total population growth (Group A) and special education population growth (Group B). The Association set out to analyze the current special education enrollment and funding data to determine how these dollars are allocated within the designated categories.

According to the FY15 school finance data[4], Arizona has 121,602 identified special education students, representing 11 percent of the state’s student population.  The distribution of students by special education category – Group B designation – is presented in the following table in order of severity (least to greatest) and their relative funding weights (lowest to highest). The student count represents the total number of identified students, based on their Individual Education Plan. The weight identifies the multiplier that is used in the funding formula found in A.R.S. § 15-943; each category has an associated weight. This multiplier generates the weighted student count, which is then multiplied by the base funding level of $3,373.11 for most charters and $3,415.27 for most districts. The associated funding levels by category and per pupil allocations are a result of the funding formula.

This shows 84 percent (102,142) of the state’s special education population are identified as having emotional disabilities, mild intellectual or learning disabilities, speech impairments and other health impairments. This group of students is funded by both the Group A and Group B portions of the formula.  As evidenced in the table, the small funding weight (.003), results in a weighted student count of 306 students.  In other words, this large group (102,142) is funded as if there were only a small number of students (306) in the state with these characteristics. The result is a per pupil amount of $10.24, in addition to Group A funding.

The remaining 16 percent of special education students (19,460) are funded as significantly higher weights given their designations.  Students diagnosed with multiple disabilities and severe sensory impairments (MD-SSI) are identified as the most significantly impacted group and therefore receive the highest funding weight.  As evidenced in the table, the large funding weight (7.947), results in a weighted student count of 6,008 students.  In other words, this small group (756) is funded as if there were a large number (6,008) in the state with these characteristics.  The result is a per pupil amount of $27,149.88.

While $10,781 to $27,149 may seem like a lot of money for each special education student, the implementation of the current funding formula lacks an understanding of the needs, and recent estimates of the actual costs of serving special education students.  The 2007 cost study recommended both increases to the Group A and Group B weights to account for the expenses incurred to support students’ needs.  However, we know that the needs identified in 2007 have not been properly addressed and it’s likely that these needs have changed in the last eight years. Policy makers should consider the current categories and funding weights as they make recommendations for future modifications.

This is Part II in the Association’s series on Special Education funding. Read Part I here and Part III here.

Footnotes/References
[1] Special Education Cost Study at: http://www.azed.gov/specialeducation/files/2011/06/specialeducationcoststudy2007.pdf
[2] “Group A” means educational programs for career exploration, a specific learning disability, an emotional disability, a mild intellectual disability, remedial education, a speech/language impairment, developmental delay, homebound, bilingual, other health impairments and gifted pupils pursuant to A.R.S. § 15-752.
[3] “Group B” means educational improvements for pupils in kindergarten programs and grades one through three, educational programs for autism, a hearing impairment, a moderate intellectual disability, multiple disabilities, multiple disabilities with severe sensory impairment, orthopedic impairments, preschool severe delay, a severe intellectual disability and emotional disabilities for school age pupils enrolled in private special education programs or in school district programs for children with severe disabilities or visual impairment and English learners enrolled in a program to promote English language proficiency pursuant to A.R.S. § 15-752.
[4] Special education funding data were used for this analysis, specifically student counts that are used for the calculation of the state equalization formula for fiscal year 2015. Student counts are provided by each Local Education Agency (LEA) to the Arizona Department of Education (ADE) and can be found in LEAs’ individual APOR (districts) and CHAR (charters) reports. Student counts are found at: http://www.ade.az.gov/Districts/EntitySelection.asp. It is necessary to download reports one LEA a time.
Categories
Education Blog

Special Education Funding Matters to All Students – SPED Series, Part I

One in forty boys in Arizona is diagnosed with an Autism Spectrum Disorder[1]. This statistic and others indicate a growing population of students with special needs in our schools.  Given this, it’s not surprising that policy makers, teachers, and advocates have been calling for additional supports for students with special needs. The Governor’s Classrooms First Council has taken up this call during its discussions of Arizona’s school finance formula.

The Classrooms First Council released their preliminary recommendations[2] in September. The recommendations represented significant consensus among the Council in three key areas: equitable funding, student-centered learning priorities, and recognition of excellence. Two key student-centered learning priorities recommendations received wide spread support: (1) fund special education students according to the 2007 cost study and (2) fund the existing “Extraordinary Special Needs Fund” to address high-cost students for all public schools. These recommendations were made while recognizing additional new dollars would be needed for implementation. The 2007 cost study demonstrated that $144.8 million[3] in additional funding would be needed just to fund expenses; adjusted estimates based on an inflator formula put these dollars closer to $400 million today. These estimates do not address the funding of the Extraordinary Special Needs Fund.

Given the strong support for these two recommendations, the Association set out to analyze special education funding data to determine the magnitude and potential impacts of these recommendations.  The findings of our analyses will be released throughout the next months. The first in this series presents longitudinal trends in special education enrollment as well as current student enrollment data by disability type and severity and addresses the first policy recommendation of the Council.

The Findings

The first policy recommendation — fund the 2007 special education cost study — appears to be straightforward. Our analysis of current special education data indicate that the impact of this recommendation is likely significantly greater than initial estimates. Initial estimates indicated that the gap (in 2007) was $144.8 million in additional funding. However, that estimate was based on 2006-07 enrollment data, which indicated a statewide total special education student enrollment of 117,095.78[4]. National Center for Education Statistics data reported for the same time period indicates that statewide special education student enrollment for the same time frame was 124,019; this 6% difference is a significant underestimation of students in the initial cost study. Analyzing the longitudinal trends from 2006-07 to 2013-14 indicates that Arizona’s special education population has increased by 5% (see table).

Given the increased special education population demonstrated in the longitudinal analysis, it’s reasonable to believe that the initial cost estimates will need significant adjustments to account for the current special education enrollment. These adjustments are necessary to appropriately fund services designated in students’ Individualized Education Plans (IEPs), as these expenditures are legally required and services are federally protected. This is true regardless of how much K-12 funding the state provides.

As a result, school districts and charters are forced to make untenable decisions regarding the allocation of tight resources. Since special education services must be delivered, no matter the amount of statewide education funding, school districts and charters must pull resources from the 88 percent of students who are not designated to receive special education services.  Alternatively, the under-funding of special education creates dis-incentives to properly identify, serve and support these students. Neither of these options supports our students.

This is the first blog in our Special Education Funding series. Part II can be found here, and Part III can be found here.

Footnotes/References

[1] http://www.cdc.gov/ncbddd/autism/states/addm-arizona-fact-sheet.pdf
[2] Classrooms First Council Recommendations http://education.azgovernor.gov/sites/default/files/cficpreliminaryframework9-22-15revisedv4.pdf
[3] Classrooms First Council presentation on special education funding http://education.azgovernor.gov/sites/default/files/8-27_sclp_presentations_all.pdf
[4]2007 Special Education Cost Study www.azed.gov/special-education/files/2011/06/specialeducationcoststudy2007.pdf, the cost study utilized Average Daily Membership (ADM) which results in portions of student funding, hence the 117,095.78 figure used.
[5]
 NCES data U.S. Department of Education, National Center for Education Statistics, Common Core of Data (CCD), “Local Education Agency (School District) Universe Survey”, 2006-07 v.1c,  2007-08 v.1b,  2008-09 v.1a,  2009-10 v.2a,  2010-11 v.2a,  2011-12 v.1a,  2012-13 v.1a,  2013-14 v.1a; “State Nonfiscal Public Elementary/Secondary Education Survey”, 2013-14 v.1a.

Categories
Education Blog

Charter Student Enrollment Increases

Despite a tumultuous legislative session that had significant impacts on charter schools, charter student enrollment continues to rise. Initial estimates indicate that an additional 10,000 students attend a charter school this year, which is a 6.3 percent increase.

During the 2015 session, the Arizona Legislature passed two significant policies directly impacting charter schools – policies that may have impacted student enrollment. The state now funds charter schools based on the total number of students in a “network,” or groups of affiliated schools. These charter school networks are now treated, for the purpose of funding, similarly to traditional school districts. Additionally, the Legislature made significant changes to district sponsored charter schools in FY2015, requiring most to revert back to traditional district status.

The number of unique charter organizations dropped from 267 in FY15 to 250 in FY16, due in large part to the State Board of Charter Schools closure of 27 campuses as well as the 59 districtsponsored charter schools the Legislature forced to revert back to traditional district status.

In our June 2015 blog, we introduced you to Arizona’s largest charter organizations. Table 2 shows these charters with their updated FY2016 data.  While the organizations in the top 10 remained stable from 2015 to 2016, the composition of the list changed significantly. The top two charter networks, Great Hearts Academies and Basis Schools, both experienced substantial enrollment increases, with Basis Schools taking the top spot.

The ten largest charter organizations enroll nearly 41 percent of all charter students. Charter market share for the two largest networks increased to 12 percent in FY16. The table also shows the relative ranking of charter organizations based on their share of charter student enrollment.  The majority of the rankings were impacted by these initial FY16 estimates: 6 out of 10 school networks shifted their relative positioning within the ranking.  These results continue to indicate that enrollment patterns within the state’s largest charter networks vary.

For charter school supporters, these data are heartening given the impacts of the 2015 Legislative session on charter schools. For supporters of increased access to quality school options, these data also provide evidence that Arizona’s highest performing charter networks are continuing to increase their impact and represent a significant population of Arizona’s charter student enrollment.
Categories
Education Blog

Move On When Reading? Keeping the Bar Low (Until 2017)

While it is an urban myth[i] that prison population projections are based on the number of third graders that cannot read — a connection exists between incarceration and failure to read. A student not reading by the end of third grade is four times less like to graduate, and high school dropouts were 63 times more likely to see the inside of prison walls than college graduates[ii].

In an effort to combat those statistics, the state’s Move on When Reading (MOWR) law[iii] requires schools to retain third-graders who fall far below reading standards.

With 44 percent of our third graders scoring “minimally proficient” on AzMERIT, it was surprising that in August the Arizona State Board of Education set the bar based on past exam levels, allowing only three percent of Arizona’s third-graders mandated access to “intervention and remedial strategies.” Despite test results demonstrating more of our students lack the skills to graduate high school, the State Board set a policy that keeps the bar low for the 2015 and 2016 administrations of AzMERIT.

So…Why Does it Matter?

Arizona’s measures for determining the academic preparedness of our students have long differed from external measures, namely national assessments. In the 2013 AIMS results, 77% of fourth and 72% of eighth grade students were proficient in reading; however, the 2013 National Assessment of Educational Progress (NAEP) results show that 72% of Arizona fourth- and eighth-graders were NOT proficient in reading, compared to 66% of students nation-wide. As our students matriculate to high school, we see the ramifications of these results: 25% of Arizona students do not graduate from high school with their class, according to statistics from the Arizona Department of Education.

How is it possible to have such differing diagnoses from the state and national exams? The 2013 NAEP Mapping Study[iv] demonstrates the disparity. The following chart represents the alignment between NAEP expectations and state proficiency expectations in reading. It is clear that Arizona’s AIMS proficiency standard is significantly lower than both the NAEP Proficient and Basic cut scores. The chart also illustrates how it is possible for students identified as proficient on AIMS to simultaneously score well below the Basic level on NAEP.

In response to these facts, Governor Doug Ducey[v] communicated the following during his remarks to the State Board of Education in March:

“First, Arizona’s scores are too low – unacceptably low. Second, we’re giving false assurance to too many parents that their kids are well-prepared for life or college — when in fact they are not. So we need to commit ourselves to achieving excellence.  And when we see excellence, we should understand who and what creates it and export those best practices to other schools so that they can benefit from it.

This Board – along with my office and the Legislature – needs to design policies that get Arizona on a path to significant improvement in the quality of education.  It won’t happen overnight, and it’s a long-term proposition, but it can be done and we need to make that our primary focus.”

The State Board developed policies in response to this call to action. The Performance Level Descriptors adopted by the Board and used extensively by teachers during standards-setting established high expectations for proficiency that were critical to beginning to align our state’s outcomes to national measures, and furthermore, to prepare Arizona students for college or career. According to the Department’s materials, the AzMERIT performance standards are generally comparable to the performance standards on NAEP.

It was widely acknowledged throughout the standards-setting process that teachers understood that students taking the exam in 2015 were not prepared or ready to meet the higher standards, yet teachers recommended appropriate standards anyway. Dr. Joe O’Reilly, an external observer and school district employee, presented his observations regarding the standards-setting process and teachers’ commitment to educational excellence in his memo to the Board:

“Teachers took their training to heart. We heard them say things to each other like ‘I want to make sure we are setting it at college and career ready, not too low, not where a student is not really college and career ready.’ They also discussed why the results turned out as they did and said things like ‘we are setting this for what we want students to be able to do, not what they can do now,’ ‘that [item’s results] is a teacher issue and where the teacher is on the new standards,’ and ‘that should be an easy item if it was taught properly.’ ” (P. 3)[vi]

Our state’s past academic results along with the overwhelming acknowledgement by educational professionals, parents, policymakers, and the business community contributed to the Board’s decision to establish higher, more rigorous standards for AzMERIT on August 14, 2015.

So…How Did This Happen?

Why, despite the Board’s prior moves to rigorous expectations, did the Board take a step backwards towards old expectations and performance standards?  A.R.S. §15-701 required them to set the cut score using “reading scores.” Alternative recommendations to set it at the Minimally Proficient level, using the English Language Arts (ELA) scores, were dismissed due to this interpretation. Unfortunately, the Department didn’t provide an alternatively rigorous reading score, one that might have aligned more closely to the Minimally Proficient level, for the Board to consider.  Simply put, the Board was left with only the AIMS equivalent cut score as an option.

In an attempt to ameliorate their decision, to revert to lower standards and old expectations, the Board approved a measure that would avoid providing confusing information to parents of existing fourth graders. Students impacted by the Board’s decision are still eligible for remediation support, despite being promoted, so this information will be provided to schools only with the expectation that students receive interventions during the 2015-16 school year.

The Board also acknowledged that the approved cut scores don’t reflect the level of rigor and expectations for reading and are inconsistent with their previous decisions to set high expectations for passing on AzMERIT.  Their motion required the Department to reconvene a standard setting committee to provide a recommended “falls far below” level for subsequent years that is in alignment with the AzMERIT expectations. Lastly, the Board will seek additional legislation regarding Arizona’s Move on When Reading statute to align it with the current statewide assessment, specifically the use of an English Language Arts assessment.

So…What Does This Mean?

Although a majority of Arizona fourth- and eighth-grade students were deemed “proficient” in reading in the 2013 AIMS results, these same students fell far short of expectations for proficiency on the national exam (NAEP). Expectations vary state-by-state, and in many cases, individual states’ expectations fall short of the requirements of the national exam – Arizona is one of these states.

In March, Governor Ducey called for action to raise the state academic standards to more closely align with national standards, and to better prepare Arizona students for college and career. The State Board has responded, developing curricula requirements and implementing assessments that match the performance standards of the NAEP.

Despite these advances, third graders in 2016 will be passed on at the same rate as their predecessors who were subjected to lower standards and expectations. This slow transition to a more rigorous standard in 2017 will mean thousands of children will be duped into thinking they are on track for college and career when they are not.
Footnotes/References
[i] http://www.theatlantic.com/business/archive/2012/07/an-urban-myth-that-should-be-true/259329/
[ii] http://readingpartners.org/blog/do-prisons-use-third-grade-reading-scores-to-predict-the-number-of-prison-beds-theyll-need/
[iii] A.R.S. §15-701 http://www.azleg.gov/FormatDocument.asp?inDoc=/ars/15/00701.htm&Title=15&Doc
[iv] Bandeira de Mello, V., Bohrnstedt, G., Blankenship, C., and Sherman, D. (2015). Mapping State Proficiency Standards Onto NAEP Scales: Results From the 2013 NAEP Reading and Mathematics Assessments (NCES 2015-046). U.S. Department of Education, Washington, DC: National Center for Education Statistics. Retrieved 8/18/15 from http://nces.ed.gov/pubsearch.
[v] http://azgovernor.gov/governor/news/governor-duceys-remarks-arizona-state-board-education
[vi] August 14, 2015 agenda materials https://azsbe.az.gov/public-meetings 
Categories
Education Blog

The Disconnect Between Student Funding and School Letter Grades

School finance has been the topic of lively debate in Arizona, recently.  Parents, school leaders, and politicians from both political parties have openly expressed their concern over years of budget cuts, while newspapers continue to report school funding as a major concern of educators, expressed at the Superintendent’s “We Are Listening” tour.  Add to that a recent report by the U.S. Census Bureau that ranks Arizona at or near the bottom in per pupil spending, and it’s clear that school funding is an issue that needs to be addressed.

Although recent discussions about school funding would make it seem that urgent reform is needed, data reported from the Arizona Department of Education earlier this year paints a different picture.  Every year, the Department assigns letter grades to public schools based on a combination of their students’ performance on standardized tests and academic growth.  Although these grades are not perfect measures of school quality, they offer insight into how a school is serving its students.  When school letter grades were released to the public last August, education advocates were pleased to announce that schools were not only doing well, but that they had improved from the previous year.  Our analysis showed that that 61 percent of public schools received an A or B rating and that nearly 70 percent of public school students attended an A or B rated school.  Looking at these statistics, it seems that Arizona’s public schools are doing quite well.

Taken together, the fact that Arizona ranks at or near the bottom in per pupil spending at the same time it enrolls 70 percent of its students in A and B rated schools may be seen as an argument against increasing school funding.  In fact, these data could be interpreted to indicate that perhaps Arizona public schools are fine just the way they are.

We believe, however, that this is not the case. As we’ve written previously, Arizona’s school letter grades are not reflective of the true state of education in Arizona.  This is problematic for school funding and education reform advocates because, by our state’s own measures, Arizona schools appear to be doing well despite years of budget cuts.  However, consider the fact that in 2013, Arizona ranked 42nd in fourth-grade reading scores and 22nd in fourth-grade math scores on the National Assessment of Educational Progress.   Also, roughly 44 percent of high school graduates do not enroll in post-secondary institutions upon graduation and only 19 percent receive a diploma from a four-year institution six years after graduating from high school.  These data surely paint a very different picture of school performance.  It is plausible to assume that in order for Arizona to improve on these external measures of student performance, schools will need additional resources.  As the old adage states: the definition of insanity is doing the same thing over again and expecting a different result.

So then, if we believe that our schools are likely to require more resources then we must be clear about student outcomes.  This is not to diminish the work of teachers, principals, and students at A and B rated schools.  Earning these labels requires significant effort and should be commended.  However, we must also acknowledge that earning an A or B, in a system that essentially norms public school performance, does not mean that students are college and career ready.  If Arizona students are to receive the education that they deserve, then we must do more to provide them with access to rigorous curricula, excellent teachers, and resources that will prepare them to be happy and productive citizens in the 21st Century.  Doing this, however, costs money.

In the coming months, policy makers, educators and business leaders plan to address some of the state’s most pressing education issues. The Governor’s Classrooms First Initiative Council is faced with the daunting task of school finance reform.  At the same time, the Arizona State Board of Education and the Department of Education will begin redesigning A-F letter grades.

The Association will play an active role as technical advisors on both issues. As we advocate for increased funding for students, we will also be clear to decision makers that Arizona students deserve better schools.

Categories
Education Blog

A Closer Look at Arizona’s Largest Charter Organizations

The Arizona Legislature recently ended its 2015 session and one of the more significant pieces of education policy to emerge from it is the recognition of charter school “networks,” or groups of affiliated charter school organizations.  In short, the Legislature has determined that charter schools that are part of a network should be treated as one organization, rather than individual entities, for the purpose of state funding. The result is that these charter school networks are funded similarly as traditional school districts.

Since 1994, Arizona has treated charter schools as independent entities, even if they are part of a larger group of charter schools.  As a result, little information exists about the number of charter “networks” that exist or how large they are. The Association has combined information from the Arizona Department of Education with charter school affiliations collected by the Arizona Charter Schools Association to begin to fill the information gap.

Taking this new view of charter schools, Arizona has 267 unique charter organizations, where some are networks of affiliated schools and others are a single school campus operating independent of any other school or charter organization.  Combined, all charter organizations in the state enrolled nearly 150,000 students in 2014 and nearly 160,000 students in 2015, excluding district-sponsored charter schools.

Table 1 shows that in the last two years, the ten largest charter organizations — networks and single charter organizations — enrolled nearly 40 percent of all charter students.  In 2015, the two largest organizations enrolled nearly 11 percent of charter students.

The table also shows the relative ranking of charter organizations based on their share of charter student enrollment.  Nine out of ten charter organizations appear on both lists; however there is movement in the rankings.  For example, Great Hearts Academies rose from fourth to first, while Imagine Schools dropped from first to fourth. These data demonstrate that eight out of the ten schools relative rankings shifted from 2014 to 2015, all but Legacy Traditional Schools and EdKey, Inc. This suggests that while there is a concentration of charter enrollment in the state’s largest charter organizations, enrollment patterns within this group varies.

It is unclear from these data the reasons why these networks are successful in enrolling a large proportion of the state’s charter students. However, these data provide an opportunity to ask questions about the types of schools parents are choosing to enroll their children. These charter organizations represent a variety of instructional models from back to basics to online, indicating that a large number of families are making enrollment choices across instructional methods.  Additionally, the top three networks in the 2015 rankings represent schools that focus on academic rigor and college and career readiness through their unique instructional methods.  Whereas, in the 2014 rankings, one of the top three networks, Leona Arizona Management, LLC, has diverse curriculum at its schools, including several that focus on students who have been unsuccessful in traditional settings.

These data also present additional policy and research questions for the future. How are the innovation, flexibility, and freedom from bureaucracy at the heart of the charter movement kept alive in these large charter organizations? If enrollment continues to concentrate in larger charter organizations, what is the future of the small, independent charter school? And most importantly, what does all this mean for students?

Categories
Education Blog

What About Poverty? Food for Thought on the Classroom Spending Debate

Educating children often requires much more than quality instruction; most educators agree on the need to offer services that meet students’ social, emotional, and material needs if students are to succeed in the classroom[1]. Depending on the school, grade level, and student demographics, these additional needs can take the form of school counselors, social workers, before and after school programs, or parent outreach. Such services have been a part of the recent discussion around classroom vs. non-classroom spending.

Missing from the conversations about spending is an acknowledgement of the percentage of students in Arizona public schools who are living in poverty and as a result are more likely to need and benefit from “non-classroom” services.  In the coming year, schools will likely face further reductions in budgets and increased pressure to “put more money in the classroom.”  In order to provide some context and insight into the challenges facing Arizona public schools, the Association feels that it is beneficial to examine statewide trends in student poverty[2].

The graph presents statewide student enrollment in Arizona’s public schools and the number of students who qualified for free and reduced price lunch during the past 10 years[3].  As the graph shows, overall enrollment in Arizona public schools has fluctuated at just over one million students during this time. In comparison, the data indicate a steady increase in the percent of students eligible for free and reduced price lunch from 2007-2008 through 2013-14. In the most recent year, there is a slight decrease (-3%) reported.

The slight decrease in poverty in 2014-2015 may be an indicator of economic recovery and if it continues one would expect a decrease in the demand for student supports in schools as fewer families live in poverty.  All other school spending being equal, one would expect a corresponding increase in the percent of funding that goes to the classroom.

The relationship between poverty and the percent of funding that goes inside or outside of the classroom is a research and policy question worth pursuing. The insights gained from this research can help policymakers understand the larger economic dynamics at work in Arizona’s public schools.  These data may be useful in determining whether the percent of dollars spent outside of the classroom is a reflection of inefficiencies in the system, as it is often portrayed, or a reflection of the level of need in the student population.  The Association believes that these data are important for policy makers to consider as they begin to better understand the context of school level expenditures.
Footnotes
[1] Moore, K.A., & Emig, C. (2014). Integrated student supports: A summary of the evidence base for policymakers. Bathesda, MD: Child Trends.  Retrieved on 5/1/15 from http://www.childtrends.org/wp-content/uploads/2014/02/2014-05ISSWhitePaper3.pdf.
[2] Data for this analysis were taken from the “Average Daily Membership” (ADM) and “Percentage of Children Approved for Free or Reduced-Price Lunches” files made publicly available by the Arizona Department of Education.
[3] We acknowledge that eligibility for free and reduced price lunch is a proxy indicator of poverty and that there are limitations to its usefulness. Schools that do not participate in the National School Lunch Program do not have FRL data and there are a number of reasons why schools may not participate in the program.  However, this does not mean that these schools do not enroll poor children.  As a result, the numbers reported by the state should be considered conservative estimates.
Categories
Education Blog

Where Do Public School Tax Credits Go? A Look at Arizona’s Public Schools’ Tax Credits, Part IV

Over the last few months, we’ve brought you an analysis of Arizona’s public school tax credits, how they’ve changed from 2005-2013, and which schools benefit from them. Find our first blog here and our second blog here and our third blog here.  For our final blog post on this topic, we will describe the types of programs that public school tax credits currently support. Our analysis uses 2013’s data which is the most recent year available from the Arizona Department of Revenue.

The law allows public school tax credits for extracurricular activities defined as “school sponsored activities that require enrolled students to pay a fee in order to participate including fees for band uniforms, equipment or uniforms for varsity athletic activities, and scientific laboratory materials [1].” In 1997, lawmakers expanded eligible programs to include “character education.” Character education programs must emphasize positive character traits like truthfulness, responsibility, compassion, diligence, and sincerity [2].

In 2013, Arizona public schools spent just under $50,000,000 of their tax credit donations, the largest portion of which was spent on sports and athletic programs ($13,715,249).  The next largest expenditure categories were field trips ($9,613,643) and fine and performing arts ($8,436,035).  Combined, these three categories comprised over 50% of tax credit expenditures in 2013 or just under $32,000,000.

Starting in 2011, as a temporary measure, public schools were allowed to use up to fifty percent of unencumbered contributions received on or before December 31, 2010 on short-term capital items such as textbooks, equipment, technology, library resources, instructional aids, and transportation vehicles. This provision expired on June 30, 2013.


Summary

Our previous analyses have shown that public school tax credit contributions continue to increase annually and that these contributions are increasingly benefiting more affluent students while donations at high-poverty schools have remained relatively low and stagnate over the last nine years.  These expenditure data suggest that a significant amount of tax credit contributions are funding fee-based activities and a relatively small amount is funding character education or scientific laboratory materials, as the law suggests.

DATA AND METHODOLOGY

The primary data for this blog series consists of school-level tax credit amounts reported by schools for years 2005 through 2013. These files were obtained from the Arizona Department of Revenue [3] and include the total number of donations a school received, the total dollar amount received, and the total amount spent for each year.  Additionally, for years 2011-2013, these files contain information about tax credit expenditures by category.  To enhance our understanding of school-level characteristics, we linked the tax credit data to enrollment [4] and poverty data [5] obtained from the Arizona Department of Education.

The Department of Revenue collects data from each public school in the state and in most cases the data are reported for each school. In some cases, the data are reported as aggregated district amounts. For our analyses, we utilized all data reported, whether by district or by school, for all state summary tables and graphs. Where our analysis required school-level information, the district-level cases were omitted.

While the tax credit may be taken for either a general contribution or for fees, the Department of Revenue data does not draw a distinction. As a result, there is no way to know whether the amounts schools receive are donations that can be used at the discretion of the school, or whether they are in the form of fees that are, in practical terms, earmarked for a particular student.

For our expenditure analysis, we took each expenditure category listed in the tax credit file and summed them across schools to determine a statewide total expenditure by category.  Because several categories listed in the tax credit file overlap (i.e. “sports” and “athletics”), we chose to combine them.  These categories are athletic and sports programs, fine and performing arts, extended day and summer programs, cheerleading and rifle team, and driver’s education programs.

Footnotes/References

[1] Arizona State Legislature Private School Tuition; Tax Credit (E) A.R.S. § 43-1088 (1997) (December 1, 2014).
[2] Arizona State Legislature Character Education Program Instruction; fund A.R.S. § 15-719 (December 1, 2014)

[3] Public School Tax Credit Reports, available at http://www.azdor.gov/ReportsResearch/SchoolTaxCredit.aspx
[4] Average Daily Membership Reports available at http://www.azed.gov/finance/reports/#SafrTop
[5] Percent of students who qualify for the National School Lunch Program, available http://www.azed.gov/health-nutrition/frpercentages/