Categories
Association Blog In the News

Arizona Parents Want School Choice and Support Charter Schools. Here’s Proof

By Jake Logan and Nina Rees

Arizona classes are back in session.

For parents of the more than 1.1 million Arizona students enrolled in a public school, it’s hard to imagine that less than a generation ago, the decision about where your child would attend school was made for you, not by you.

Indeed, many of us are old enough to remember a time when school assignment was dictated not by a student’s needs, but by the neighborhood in which his or her parents could afford to live.

In Arizona, that was the reality until 1994 when Arizona enacted charter school legislation. Together with the adoption of district open enrollment, the statutory changes affirmed a simple principle: Parents know best when it comes to picking the right school for their child.

Categories
Education Blog

ALTERNATIVE SCHOOLS: JUST THE FACTS

As the debate over a new accountability system for Arizona rages on, alternative schools across the state are facing the unknown for how their educational philosophies and outcomes will be measured in the years to come. Alternative school accountability methods are anticipated in August 2017, but who are these alternative schools, and whom are they serving? This month, the Association examines these Arizona schools that often go overlooked, and their role in the state education system moving forward.

Our research shows two notable facts:  (1) from 2012 to 2015, alternative schools – both district and charter – have seen rising four- and five- year  graduation rates, and (2) the number of alternative schools and number of students enrolled in alternative schools have declined since 2012 by 18% and 16%, respectively.

WHO ATTENDS ALTERNATIVE SCHOOLS?

Alternative schools are defined as schools that serve specific populations of at-risk students. “At risk” is defined in statute as a student who meets any one of six categories- documented disruptive behavior, dropout,  struggling academically, adjudicated, primary care giver or ward of the state.  In addition, it is estimated that alternative schools – which are predominantly charters – serve a higher percentage of racial minorities, English language learners, free and reduced lunch populations, and special education students than the state average.

Although 43 states and the District of Columbia have formal definitions of “alternative education,” there are significant variations across state borders. Some states’ alternative schools offer regular instruction, social skills support, career education, or behavioral services, while others’ do not. In general, though, alternative education programs are developed to serve students who are unable to benefit from “traditional” school programs; this can include those with behavioral problems, those who have dropped out, or those with chronically poor attendance.

Arizona has its own set of rules as to who an alternative school is meant to serve, which includes students who are more than one year behind in academic credits, adjudicated students, or students who have dependents. A full definition of Arizona alternative schools and school populations can be found here. Arizona schools must request Alternative School Status through the department of education, and adhere to guidelines set forth by the state.

In line with the very mission of alternative schools, it follows that compared to statewide averages, a higher percentage of at-risk students are being served by alternative schools.

At-Risk Populations in Alternative Schools

In addition, the Association estimates that alternative schools are serving a higher percentage of black and Latino students than the state average, but a lower proportion of white students than the state average. Due to the often-small populations within alternative schools, much of the data regarding race and ethnicity was redacted from pubically-available files. The below table represents an estimate of alternative school composition, based on available data.

Estimated Ethnicities for Alternative Schools, Compared to Arizona State Averages

TRENDS IN ALTERNATIVE SCHOOLS

In the past five years, the number of alternative schools in Arizona has been declining, along with enrollment. Interestingly, the number of charter alternative schools has stayed relatively stable during the time period, while a reduction in the number of district alternative schools has fueled the waning trend within the sector. This phenomena may be partially explained by the Arizona Department of Education’s alternative school application process which began in 2014 and required both a formal application, verification and auditing of student data.  It is unclear whether the decline is a function of rejected or reduced applications to the state.

The enrollment data for alternative schools looks similar to the above graph; there were close to 30,000 alternative students in FY12, but that number has since fallen to 23,170 in FY16.

It should be noted that from 2012 to 2015, alternative schools – both district and charter – have seen rising four- and five- year  graduation rates. The department of education reports graduation rates over the span of four to seven years for each cohort of potential graduates that enter high school within a given year. That is, students can be reported as graduates in four years (most typical), five, six, or even seven years. The difference between four-year to seven-year graduation rates is an especially critical difference for alternative schools, who often work with former dropout students or students with dependents. For the purposes of this blog, the Association examined four- and five-year graduation rates within alternative schools[1] over the past four cohorts of incoming high schoolers. We found that for the 2015 cohort, an average alternative school graduated 38% of its eligible students in four years. Given that same cohort, though, alternative schools, on average, had graduated 49% of their students over the course of five years. The below graph shows how average graduation rates in alternative schools have increased over time for all alternative schools:

WHAT IS NEXT FOR ALTERNATIVE SCHOOLS?

The A-F letter grade accountability system for public schools, including alternative schools, was put on hold after the 2014 results.  Alternative schools are subject to different performance criteria than traditional schools; their accountability labels also differentiate them as alternative schools, i.e.,  “A-ALT” or “B-ALT”.  The 2017 A-F accountability systems will continue evaluating traditional and alternative schools separately.  Given the relative number of alternative schools it’s not surprising that little time has been spent on the development of the alternative school framework.

In terms of alternative schools in the larger educational landscape, it’s interesting to see the potential impact that an accountability policy decision (application and enrollment audits) had on both quantity and quality of a particular school type.  These data suggest that a corresponding reduction in the number of alternative schools positively impacted the overall quality as measured by increased graduation rates.  Is it this simple? Could a straightforward application and student enrollment audit weed out poor performing schools? Certainly, these data can’t confirm this hypothesis but it does beg the question.


Footnotes and References

[1] Data on six- and seven-year graduation rates is currently not posted on ADE’s website. The Association reached out to the department of education for the data, and as of this blog’s press time, the data had not been obtained.


Categories
Education Blog

THE CONUNDRUM OF MEASURING SCHOOL QUALITY: RAISE ACHIEVEMENT OR CLOSE THE GAP?

Results of the 2015 AzMERIT testing data show that students in charter schools consistently outperform students in district schools, across all racial and ethnic groups. But does the higher student achievement lead to a closing of the achievement gap between different groups of students? The Association’s analysis shows that the differences in achievement of student subgroups within charter schools actually serves to widen the already large achievement gap.

CHARTER AND DISTRICT DEMOGRAPHICS[1]

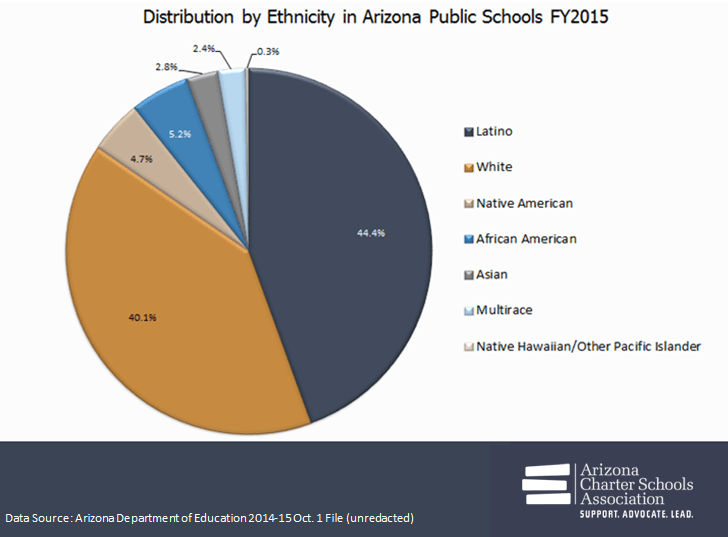
Figure 1 shows the racial and ethnic composition of all Arizona public schools during the 2014-2015 school year.  Latino students comprise the largest group (44 percent) in the state, followed by White students (40 percent). The next largest group, African American students, is only slightly above five percent of the state, followed by Native American enrollment at slightly below five percent, with all other groups reporting fewer than five percent each.

FIGURE 1: DISTRIBUTION BY ETHNICITY IN ARIZONA PUBLIC SCHOOLS FY2015

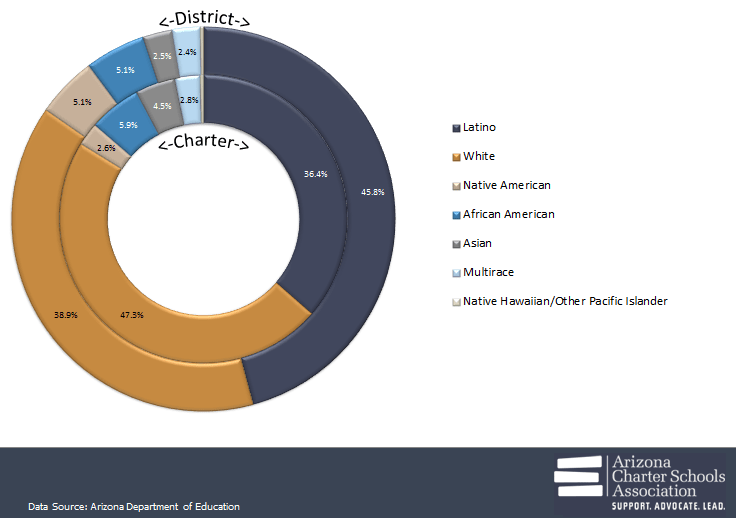
Figure 2 illustrates notable differences in the composition of district and charter school students. Charter schools serve a larger share of White students, 47 percent compared to 39 percent in district schools. Charters also serve a larger share of Asian and African American students than district schools. Conversely, charters serve a smaller share of Latino students, 36 percent compared to 46 percent in district schools, and a significantly smaller share of Native American students.

FIGURE 2: DISTRIBUTION BY ETHNICITY IN DISTRICT AND CHARTER SCHOOLS

These data suggest that White, Asian, and to a smaller extent, African American families are more likely to choose charter schools than other students and families.  When evaluating these students’ overall academic performance, this decision appears to pay off.

AzMERIT RESULTS – THE CHARTER ADVANTAGE

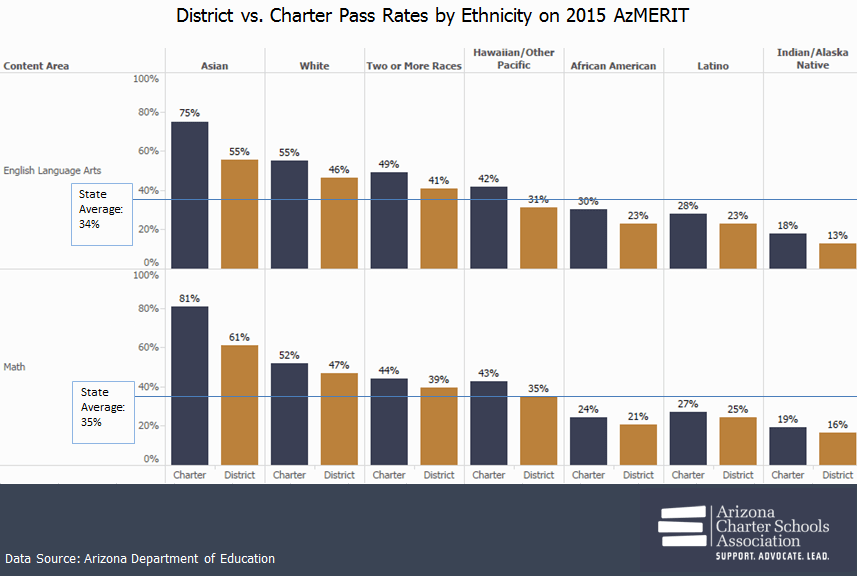
The figure below (Figure 3) shows the percent of students passing the AzMERIT exam in 2015, broken out by school type (district or charter) and student subgroup. These data combine the passing rates across grade levels in English Language Arts (ELA) and Math.  In both content areas, charter students in all subgroups have higher passing rates than their district counterparts.  These data demonstrate that charter schools are providing increased academic outcomes for the students enrolled – at least for the 2014-15 school year. For Arizona charter schools this is good news, given that a charter, by definition, is a contract to improve student achievement.

FIGURE 3: DISTRICT VS. CHARTER PASS RATES BY ETHNICITY ON 2015 AzMERIT

The charter advantage—the difference between charter and district performance—is particularly large for Asian students, a relatively small group of students in both sectors.  Charter schools enroll a significantly higher percentage of Asian students than district schools and provide a 20 point pass rate advantage over district schools in both ELA and Math. The charter advantage for White students is also significant, nine points in ELA and five points in Math.  We see a similar charter advantage for students from two or more races and Native Hawaiian/Pacific Island students.  These four groups of students account for over 55 percent of charter enrollment; they are all scoring above the state average in ELA and Math and their results help explain charter schools’ overall performance.

Latino, African American, and Native American students also see a charter advantage, but a somewhat smaller one. Despite the gains experienced in charter schools, none of these groups perform at or above the state averages in ELA or Math.

AzMERIT RESULTS – THE ACHIEVEMENT GAP

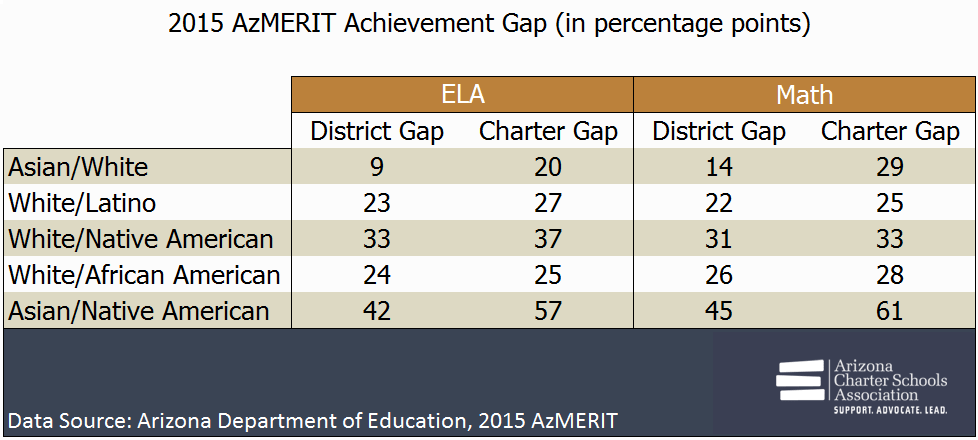
The initial results indicate there is an achievement gap between districts and charters – where overall charter students are outperforming their district peers.  The Association also wanted to investigate achievement gaps between subgroups of students within charters and districts.  The table below shows achievement gaps within charters and districts for each of the major subgroups of students, in both ELA and Math.

For example, the ELA Asian/White achievement gap (the difference between the passing rates for these two subgroups in ELA) in charter schools is 20 percentage points compared to 9 percentage points in district schools.  This means that the passing rate for Asian students in charter schools is 20 percentage points higher than their White charter peers, whereas Asian students in district schools outperform their White district peers by only nine percentage points.

FIGURE 4: ACHIEVEMENT GAP BY RACE/ETHNICITY AND SCHOOL TYPE

The most striking finding in this analysis is the relative size of the achievement gaps between subgroups, regardless of school type. With only two exceptions, all gaps are at least 20 percentage points.  Of all groups, Native American students have the lowest performance in both ELA and Math, and have the widest achievement gaps compared to their peers. The Asian/Native American gap shows the size of the extremes.

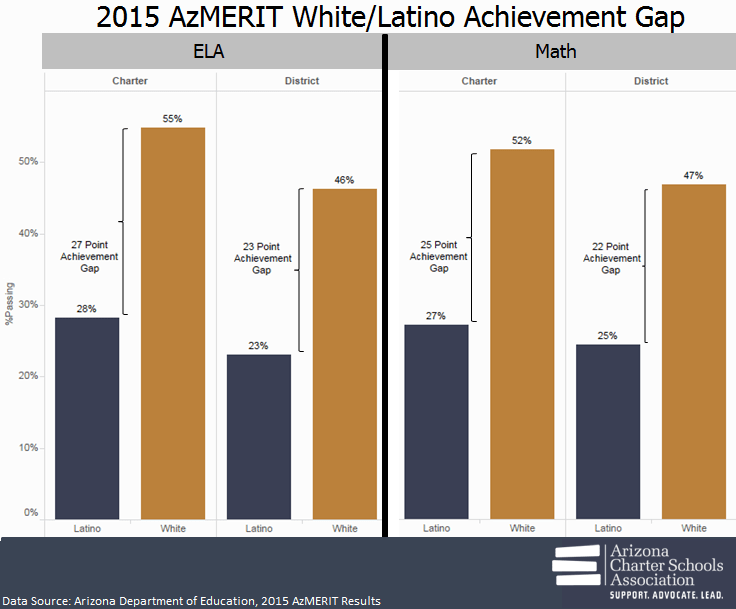
White and Latino students represent the two largest groups in the state and their achievement gap is illustrated in the figure below. Since the charter advantage for White students is greater than it is for Latino students (see Figure 3), the size of the achievement gap is greater in charter schools than in district schools.

FIGURE 5: WHITE/LATINO ACHIEVEMENT GAP BY SCHOOL TYPE


IMPLICATIONS

Policy makers are beginning to contemplate school accountability measures to evaluate the quality of Arizona’s public schools.  The new A-F formula will include a combination of proficiency and growth measures.  These data suggest that charter schools are likely to fare well in the overall evaluation when proficiency rates are compared to their district counterparts.  The new A-F system must also integrate federal requirements to evaluate subgroup performance on AzMERIT and other indicators of school quality. The evaluation of achievement gaps in subgroups is a critical component in the identification of schools for targeted and comprehensive support (federal intervention).  These data suggest that charter schools are likely to fare worse in the evaluation of achievement gaps, despite their overall higher performance.

In addition to accountability implications, these data raise questions about overall academic performance of student subgroups and ways that schools can close achievement gaps that exist among them.  Clearly, the answer is not to reduce the rate at which Asian and White students are performing in schools.  Rather, there needs to be a focus on replicating that same, or greater, performance for other student groups across all public schools.

FOOTNOTES/REFERENCES

[1] The Association used 2015 AzMERIT data for all public schools to evaluate their performance.  The AzMERIT data provided were unredacted, through a research agreement with the Arizona Department of Education; these data included details for small schools and student groups that are not available in the publicly released data file.  The demographic data included in these analyses were obtained from the October 1 Enrollment file for 2014-2015 (unredacted).

Categories
Education Blog

WILL THE PUBLIC HAVE A SAY IN ARIZONA SCHOOLS’ NEXT ACCOUNTABILITY SYSTEM?

Rating Arizona’s 2,015 public schools with a label of A-F helps the community identify the quality of the school.  Letter grades were assigned from 2012-2014 and suspended in 2015 and 2016 as Arizona students transitioned to a new statewide test.  Letter grades are based, in part, on how students perform on Arizona’s statewide test.

To grade schools in 2017, the Arizona Department of Education asked the community to participate in a Request For Information on the new A-F system’s components and methodology. However, in order to respond to 45 questions, the public must have extensive technical knowledge.  Thus while the Department of Education is attempting to solicit feedback from the public, the unintended consequence is likely to be greater exclusion of all stakeholders.

Further, anyone submitting a response to the 45 questions in the Request For Information is excluded from participating as a technical or policy advisor during A-F methodology discussions.

Public Engagement

In 2014, the State Board of Education developed the A-F School Accountability Principles of Agreement[1] in preparation for the development of the new A-F formula.  These Principles were created collaboratively with stakeholders and advocates to ensure the newly developed system aligned with the Board’s philosophical, technical and implementation expectations.  In part, the Principles state:

“A coalition of technical and policy stakeholders must be consulted to create, evaluate and refine the methodologies used in the achievement profile to ensure transparency, feedback from the field and community, and compliance with Agreements.”

Additionally, the Every Student Succeeds Act (ESSA)[2] requires meaningful stakeholder participation in the development of the state’s accountability system.  In the past, the Arizona Department of Education utilized technical advisors to support the development of accountability concepts, indicators and methodologies; they focused outreach efforts to school personnel through presentations and targeted communication strategies, and the general public had access to materials once they were available for presentations to the State Board of Education.  In response to these newly stated expectations for increased public engagement the Department released a Request For Information (RFI) for Arizona School Accountability Components and System[3] to solicit stakeholder opinions and feedback.  On the face of it, this new RFI process should yield more opportunities for broad stakeholder engagement in the development of the A-F accountability system.

Unintended Consequences

However, the purpose statement of the RFI strays from this goal.  It states “this RFI solicits feedback from interested parties with any relevant expertise, systems or methodology they have developed or conceptualized which meet the intent of any of the components described below” (page 2). This language, “relevant expertise”, is likely to alienate the general public and exclude them from the process altogether. If the purpose statement doesn’t scare the public from responding, the introduction might.  It makes it clear to the reader that responses should be framed within the new ESSA requirements, A.R.S. § 15-241, SB 1430, State Board’s Principles of Agreement, Superintendent Douglas’ plan as well as other historical documentation.  While the RFI states that respondents are invited to respond to one, any or all of the 45 questions contained – the sheer magnitude of the document is likely to limit responses.

So then, it would seem that the RFI is really designed to solicit responses from the State Board’s coalition of technical and policy advisors. The technical advisory group is made up of individuals who represent a variety of education stakeholders; large and small districts, charter schools, online schools, alternative schools, etc. The policy advisors include the business and philanthropic communities as well as advocacy organizations. These groups represent individuals who have relevant expertise, have likely developed or conceptualized systems or methodologies, and have knowledge of the pertinent statutes and requirements described. Many of the Board’s advisors have also historically provided technical assistance to the Department in the development of prior accountability systems.

The RFI makes it clear that any and all developed or conceptualized systems and methodologies or any suggestions previously submitted for consideration must be resubmitted through the RFI for consideration. This requirement applies to both the general public and to any technical or policy advisor of the Board or Department.  The RFI goes on to state, “respondents to this RFI will be excluded in evaluating and integrating responses which may or may not result in a high stakes accountability system and related competitions” (page 3).  This exclusionary language creates a catch-22 and puts all of the State Board’s technical and policy advisors in an untenable position.  That is to say, if any technical and/or policy advisor submits a response to suggest ways to create or refine the methodologies used in the achievement profiles they won’t be unable to participate in future accountability discussions and methodology decisions.

The Impact

Since 2014, Arizona schools and education advocates have been anxiously awaiting new letter grades.  Due to a two-year moratorium negotiated between education advocates and the legislature, schools have been left holding on to legacy letter grades. This is great news for the 67% of schools that earned an A or B but not ideal for the remaining schools. As the 2016-17 school year approaches, the first year of the new accountability system’s implementation, little is known about how schools will be evaluated.

The issuance of the Department’s RFI puts the development of the state’s new accountability system in jeopardy. First, the RFI will likely limit new and innovative methodologies and concepts created by Arizona’s most qualified technical and policy experts because they are unlikely to submit responses. The resulting accountability system may look very similar to prior system; despite the opportunities for innovation provided by the revised state and federal statutes. Second, it restricts the State Board’s technical and policy advisors from carrying their explicit role to “create, evaluate and refine the methodologies used in the achievement profile” as outlined in the Board’s Implementation Principle.  Each of these outcomes has the potential to undermine the newly developed system and introduce unnecessary distrust and skepticism.


References and Footnotes

[1] Arizona State Board of Education’s A-F Accountability Principles of Agreement, implementation agreements  https://azsbe.az.gov/resources/f-school-letter-grade-accountability

[2] Every Student Succeeds Act (ESSA) Dear Colleague Letter regarding collaboration http://www2.ed.gov/policy/elsec/guid/secletter/160622.html

[3] Arizona Department of Education’s Request for Information (RFI) for Arizona School Accountability Components and System http://www.azed.gov/accountability/rfi/

Categories
Education Blog

The Disconnect Between Student Funding and School Letter Grades

School finance has been the topic of lively debate in Arizona, recently.  Parents, school leaders, and politicians from both political parties have openly expressed their concern over years of budget cuts, while newspapers continue to report school funding as a major concern of educators, expressed at the Superintendent’s “We Are Listening” tour.  Add to that a recent report by the U.S. Census Bureau that ranks Arizona at or near the bottom in per pupil spending, and it’s clear that school funding is an issue that needs to be addressed.

Although recent discussions about school funding would make it seem that urgent reform is needed, data reported from the Arizona Department of Education earlier this year paints a different picture.  Every year, the Department assigns letter grades to public schools based on a combination of their students’ performance on standardized tests and academic growth.  Although these grades are not perfect measures of school quality, they offer insight into how a school is serving its students.  When school letter grades were released to the public last August, education advocates were pleased to announce that schools were not only doing well, but that they had improved from the previous year.  Our analysis showed that that 61 percent of public schools received an A or B rating and that nearly 70 percent of public school students attended an A or B rated school.  Looking at these statistics, it seems that Arizona’s public schools are doing quite well.

Taken together, the fact that Arizona ranks at or near the bottom in per pupil spending at the same time it enrolls 70 percent of its students in A and B rated schools may be seen as an argument against increasing school funding.  In fact, these data could be interpreted to indicate that perhaps Arizona public schools are fine just the way they are.

We believe, however, that this is not the case. As we’ve written previously, Arizona’s school letter grades are not reflective of the true state of education in Arizona.  This is problematic for school funding and education reform advocates because, by our state’s own measures, Arizona schools appear to be doing well despite years of budget cuts.  However, consider the fact that in 2013, Arizona ranked 42nd in fourth-grade reading scores and 22nd in fourth-grade math scores on the National Assessment of Educational Progress.   Also, roughly 44 percent of high school graduates do not enroll in post-secondary institutions upon graduation and only 19 percent receive a diploma from a four-year institution six years after graduating from high school.  These data surely paint a very different picture of school performance.  It is plausible to assume that in order for Arizona to improve on these external measures of student performance, schools will need additional resources.  As the old adage states: the definition of insanity is doing the same thing over again and expecting a different result.

So then, if we believe that our schools are likely to require more resources then we must be clear about student outcomes.  This is not to diminish the work of teachers, principals, and students at A and B rated schools.  Earning these labels requires significant effort and should be commended.  However, we must also acknowledge that earning an A or B, in a system that essentially norms public school performance, does not mean that students are college and career ready.  If Arizona students are to receive the education that they deserve, then we must do more to provide them with access to rigorous curricula, excellent teachers, and resources that will prepare them to be happy and productive citizens in the 21st Century.  Doing this, however, costs money.

In the coming months, policy makers, educators and business leaders plan to address some of the state’s most pressing education issues. The Governor’s Classrooms First Initiative Council is faced with the daunting task of school finance reform.  At the same time, the Arizona State Board of Education and the Department of Education will begin redesigning A-F letter grades.

The Association will play an active role as technical advisors on both issues. As we advocate for increased funding for students, we will also be clear to decision makers that Arizona students deserve better schools.

Categories
Education Blog

Quality Seats in Arizona Increasing Over Time

The Association believes education leads to opportunities in life, and we work hard to make data transparent and actionable. As we look at Arizona’s A-F accountability system, we are asking whether our students are in quality seats.

For our purposes, a student is enrolled in a quality seat if they attend a Tier I school (A or B rating).  At the end of the day, we want to be able to measure the change in the number of quality public school seats available for students across Arizona — district and charter.

As the Association has pointed out in several of our publications, the relationship between poverty and measures of student achievement has long been a limitation of measurement of student achievement in education. The challenge for Arizona’s accountability model is to adequately control for the effect of poverty on the final school rating. As we noted in our publications, despite the inclusion of the student growth percentiles, the A-F model still has limited use in portraying school quality due to its failure to adequately control for the effects of poverty and fairly measure a school’s contribution to learning. However, all those issues notwithstanding, we still believe analyzing these data will provide insight into Arizona’s current accountability system.

A-F data published by the Arizona Department of Education in August indicates an overall increase in the percentage of A and B rated schools, with nearly 2 out of 3 schools achieving these results (62 percent of schools were rated A or B in the traditional model). To put this number in context, in 2012 54 percent of schools were rated A or B, in the traditional model. While it’s important to see the numbers of schools improving, we wanted to take a closer look at the number of students impacted by these improved letter grades.  In order to do this we designated each school into one of three tiers based on their A-F letter grade. Tier I represents all schools receiving an A or B rating; Tier 2 are C rated schools, and Tier 3 are schools earning a D or F rating.

We analyzed the data from the past three years of A-F accountability results to evaluate the trends in the number of quality seats. The following tables present the data for all public schools — district and charter — in each of the past three years. The number of students and the percentage of their enrollment is reported annually. The data show, as expected given the overall increase in the number of A and B rated schools, a larger number of students are enrolled in a quality seat in 2014 (69 percent) as compared to 2012 (62 percent).  As the number of Tier 1 seats increased, the number of Tier 2 and Tier 3 seats decreased, demonstrating an overall improvement in the number of seats available across Arizona. However, an alarming number of seats are not rated in 2014, more than double the number in 2013. It should be noted that the Arizona Department of Education has not yet finalized the “pending” schools which account for a large number of these seats without data.

These data present an alternative lens to evaluate the impact of Arizona’s school accountability measure.  Certainly, these results are affected by countless school improvement decisions at the classroom, school, LEA and state level (including the work of the Arizona State Board for Charter Schools).  No matter the decisions being made, these data make it clear that, at least according to our A-F results, more of our students are enrolled in a quality seat now than in 2012 when we started.

Categories
Education Blog

If Not Now, When Will We Improve the Data Used in Our Schools’ Letter Grades?

In 2012, the Association released School Ratings: Improving The Data In Data-Driven Decision Making where we examined the relationship between Arizona’s A-F school letter grades and the level of poverty in a school.  We found that a school’s letter grade is highly and negatively correlated with the percentage of its students who qualify for free and reduced priced lunch.  In other words, schools with high percentages of poor students received lower letter grades, on average, than schools with more affluent students.  This relationship is due, in great part, to the way in which Student Growth Percentiles (SGPs) are used in the accountability formula. Specifically, we found that the number of “growth points” awarded in the formula is artificially capped by the calculation which uses the averages of multiple medians.

After broadly communicating these concerns to state-level policy makers, which resulted in no changes to this portion of the A-F formula, we wondered if this was still the case in 2013 and 2014. As we expected, schools continued to earn most of their letter grade from the percentage of students who are proficient on AIMS (composite points). As the percentage of poor students in a school increases, the percentage passing continued to decrease (see Tables 1, 2 and 3). A closer look at the SGP scores show, as they did in 2012, that growth points remain consistent across poverty levels, meaning that growth is not strongly related to student demographics.

As in the initial 2012 report, we again call into question the implementation of the current accountability model.  State statute (ARS§ 15-241) clearly calls for equal weight to be assigned to student achievement and growth (50-50), what we continue to see is closer to 60-40, weighted toward AIMS passing scores, a measure highly related to poverty.

Evidence from three years of A-F results indicates that under this accountability model, schools with high levels of poverty are at a disadvantage.  For example, the difference in composite points between a school where less than 25 percent of its students qualify for free and reduced priced lunch and a school where more than 75 percent qualify is 29 points, or the difference between an A and C letter grade.  Given these consistent findings, we must ask ourselves “Is our school accountability model measuring school quality or student demographics?”

In the coming year, the Arizona Department of Education and the State Board of Education have the opportunity to develop a new school accountability model to reflect the change in the state’s new College and Career Ready Standards.  We encourage our state policymakers to consider this research and develop accountability models that more accurately measure school quality, rather than student demographics, so that schools with the toughest challenges aren’t disadvantaged.