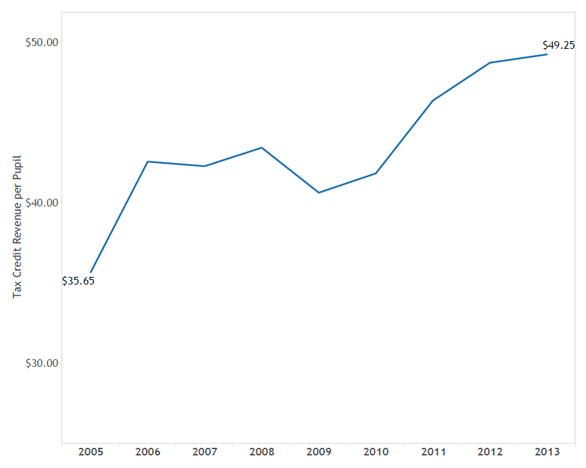
Over the last few months, we’ve brought you an analysis of Arizona’s public school tax credits, how they’ve changed from 2005-2013, and which schools benefit from them. Find our first blog here and our second blog here and our third blog here. For our final blog post on this topic, we will describe the types of programs that public school tax credits currently support. Our analysis uses 2013’s data which is the most recent year available from the Arizona Department of Revenue.
The law allows public school tax credits for extracurricular activities defined as “school sponsored activities that require enrolled students to pay a fee in order to participate including fees for band uniforms, equipment or uniforms for varsity athletic activities, and scientific laboratory materials [1].” In 1997, lawmakers expanded eligible programs to include “character education.” Character education programs must emphasize positive character traits like truthfulness, responsibility, compassion, diligence, and sincerity [2].
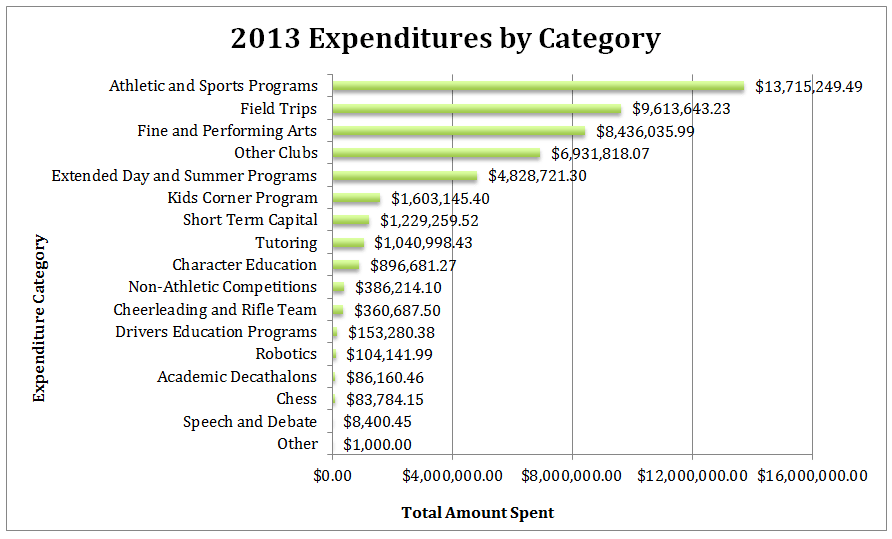
In 2013, Arizona public schools spent just under $50,000,000 of their tax credit donations, the largest portion of which was spent on sports and athletic programs ($13,715,249). The next largest expenditure categories were field trips ($9,613,643) and fine and performing arts ($8,436,035). Combined, these three categories comprised over 50% of tax credit expenditures in 2013 or just under $32,000,000.
Summary
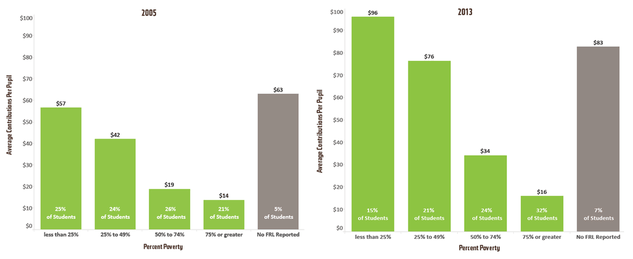
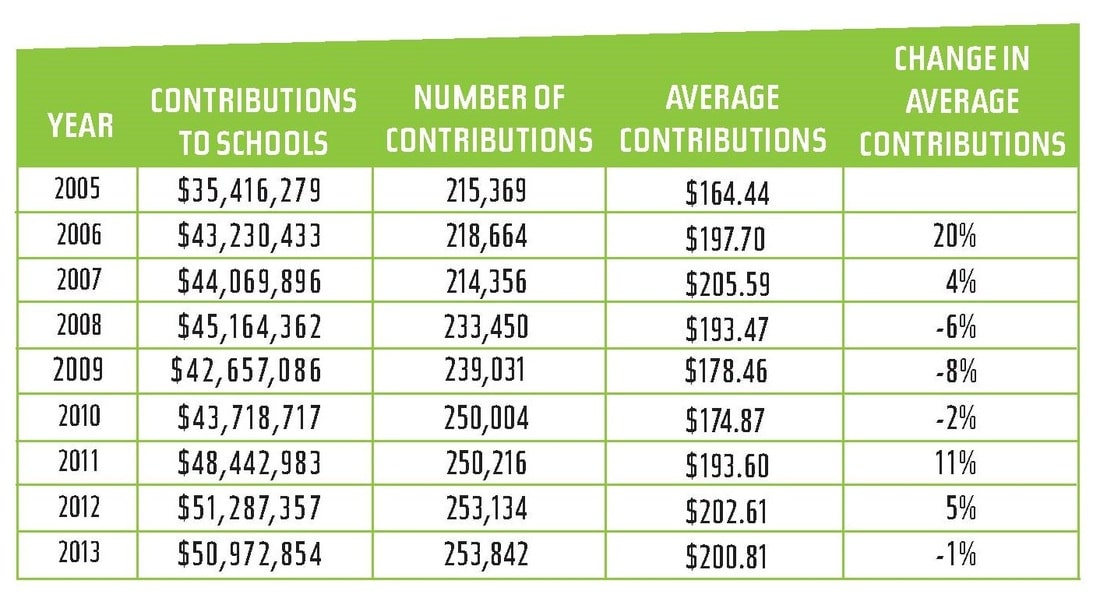
Our previous analyses have shown that public school tax credit contributions continue to increase annually and that these contributions are increasingly benefiting more affluent students while donations at high-poverty schools have remained relatively low and stagnate over the last nine years. These expenditure data suggest that a significant amount of tax credit contributions are funding fee-based activities and a relatively small amount is funding character education or scientific laboratory materials, as the law suggests.
DATA AND METHODOLOGY
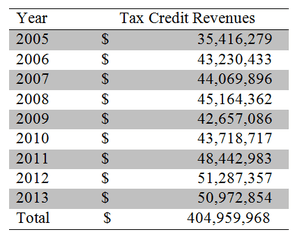
The primary data for this blog series consists of school-level tax credit amounts reported by schools for years 2005 through 2013. These files were obtained from the Arizona Department of Revenue [3] and include the total number of donations a school received, the total dollar amount received, and the total amount spent for each year. Additionally, for years 2011-2013, these files contain information about tax credit expenditures by category. To enhance our understanding of school-level characteristics, we linked the tax credit data to enrollment [4] and poverty data [5] obtained from the Arizona Department of Education.
The Department of Revenue collects data from each public school in the state and in most cases the data are reported for each school. In some cases, the data are reported as aggregated district amounts. For our analyses, we utilized all data reported, whether by district or by school, for all state summary tables and graphs. Where our analysis required school-level information, the district-level cases were omitted.
While the tax credit may be taken for either a general contribution or for fees, the Department of Revenue data does not draw a distinction. As a result, there is no way to know whether the amounts schools receive are donations that can be used at the discretion of the school, or whether they are in the form of fees that are, in practical terms, earmarked for a particular student.
For our expenditure analysis, we took each expenditure category listed in the tax credit file and summed them across schools to determine a statewide total expenditure by category. Because several categories listed in the tax credit file overlap (i.e. “sports” and “athletics”), we chose to combine them. These categories are athletic and sports programs, fine and performing arts, extended day and summer programs, cheerleading and rifle team, and driver’s education programs.
Footnotes/References
[1] Arizona State Legislature Private School Tuition; Tax Credit (E) A.R.S. § 43-1088 (1997) (December 1, 2014).
[2] Arizona State Legislature Character Education Program Instruction; fund A.R.S. § 15-719 (December 1, 2014)
[4] Average Daily Membership Reports available at http://www.azed.gov/finance/reports/#SafrTop
[5] Percent of students who qualify for the National School Lunch Program, available http://www.azed.gov/health-nutrition/frpercentages/