Categories
Association Blog In the News

Arizona Parents Want School Choice and Support Charter Schools. Here’s Proof

By Jake Logan and Nina Rees

Arizona classes are back in session.

For parents of the more than 1.1 million Arizona students enrolled in a public school, it’s hard to imagine that less than a generation ago, the decision about where your child would attend school was made for you, not by you.

Indeed, many of us are old enough to remember a time when school assignment was dictated not by a student’s needs, but by the neighborhood in which his or her parents could afford to live.

In Arizona, that was the reality until 1994 when Arizona enacted charter school legislation. Together with the adoption of district open enrollment, the statutory changes affirmed a simple principle: Parents know best when it comes to picking the right school for their child.

Categories
Education Blog

GO WEST, YOUNG STUDENTS: ARIZONA’S GROWTH SINCE THE 80’s

Most Arizonans know that the state has experienced rapid growth over the past several decades. With 1.1 million students, Arizona’s public school population was the 13th largest in the nation in 2015, the most recent year reported.

But just how quickly have student populations risen, relative to other states?

We found that Arizona’s K-12 public school population more than doubled from 1987 to 2015, according to recently released data from the National Center for Education Statistics. Only Nevada saw a larger percentage gain in students during that time period, while the nation as a whole experienced a 27 percent growth in its K-12 student population.

The table shows the top five states in terms of relative growth, along with the national totals. Click on the bar graph for a better view of each of the 50 states, and Washington D.C.

Public School Student Population Growth: Top Five

Public School Student Population Growth Since 1987: All 50 States


Most of Arizona’s growth occurred from 1987 to 2006, a nearly twenty year span when the state averaged a 3.6% annual gain in student population. Since then, the student population has remained stable at around 1.1 million students.

The visualization below shows a year-by-year look at how student populations have grown in each state. Use the “Year” filter on the right to toggle through various years and see how the student population ascended or declined in a given state that year. For best results, click the “full screen” icon at the bottom right of the tool.


Footnotes and References

Source: U.S. Department of Education, National Center for Education Statistics, Common Core of Data (CCD)

Categories
Education Blog

ARE DISTRICT ATTENDANCE ZONES OBSOLETE?

By Kelly Powell and Ildi Laczko-Kerr

A new study[1] that examines student enrollment patterns in Maricopa County found that about 37 percent of district students participate in open enrollment. Given that Arizona school choice options also include public charter schools, the Center for Student Achievement expanded the findings[2] to include charter enrollment data for the attendance zones sampled in the study. This new analysis finds that nearly 50 percent of all students in these attendance zones do not attend their assigned district school. These combined data suggest that traditional school district attendance zones are becoming obsolete.

The chart below shows the percentage of students in the studied attendance zones whose families are choosing a school other than their assigned district school, broken out by district and charter attendance.

Percentage of Total Students NOT Attending Assigned District Schools

ABOUT THE DISTRICT STUDY

Though the study was limited[3] to nine school districts in Maricopa County, the authors’ spatial analysis painstakingly mapped student addresses and school boundaries for about one-third of district elementary school students in the county. The authors restricted their analysis to the elementary grades (K-8) in the 2016 school year. These grades collectively serve over 130,000 students. Students were considered “open enrolled” if they attended a district school outside of their attendance area, including within-district (students attending another school in the same district) and between-district (students attending school in another district) open enrollment.

The impact of within- and between-district open enrollment is striking. Not including charter student enrollment, results ranged from 15 percent to as much as 57 percent of the student population choosing to utilize open enrollment.

SCHOOL CHOICE IN MARICOPA COUNTY

When the Center for Student Achievement combined charter enrollment[4] for charters located within the study’s attendance zone, we found that 47 percent of students attended a school other than the one to which they are assigned based on home address. In one sampled attendance zone, as many as 81 percent of students participated in school choice.

Counts by School Choice Option in Nine Maricopa County Attendance Zones

THE NEW NORM

This analysis points to significant community demand for school choice, given the number of students opting to attend a district school other than the one to which they are assigned, coupled with the high percentage of students attending public charter schools.

Given this analysis, Arizona policymakers should take into account the widespread use and popularity of school choice at the local and state level when developing education policies and making budgetary decisions.

References and Footnotes

[1]State of Open Enrollment in Maricopa County Oct 26th” manuscript by Matthew Hom and Patrick Cizek, October 26, 2017.

[2] The authors provided matched charter school K-8 enrollments within their sample of attendance zones.

[3] Besides limiting the number of participating Districts, the authors limited their analysis to the elementary grades. Their rationale to limit the analysis to K-8 was based in the fact that mobility patterns seemed to differ significantly in elementary and secondary levels, and without corresponding high school data for participating elementary districts, results would be difficult to interpret.

[4] An additional 25,503 students enrolled in charter schools located in the attendance zones of participating districts were included in the analysis. Enrollment counts were from the 2016 school year and were limited to kindergarten through grade 8 for “brick and mortar” schools. Online schools were not included in charter counts.


Categories
Education Blog

PROPORTIONAL GAINS – CHARTER GROWTH WITHIN SCHOOL DISTRICT BOUNDARIES, PART II

What does the growth of Arizona’s charter school movement mean for local control? School choice (in its broadest definition) decreases the number of voters with an immediate investment in the passage of local taxation questions because these parents no longer have a direct benefit from passing a bond and override in their local school district. Likewise, the parents of students attending a school district via open enrollment cannot vote for a bond and override that will benefit their child directly.

With the continued and steady expansion of charter schools, Arizona now has school districts where the majority of students within district boundaries attend charter schools. Continuing our series on school enrollment trends, in this edition we explore the distribution of students choosing district or charter schools within an attendance area. We found that several district attendance areas now have parity in the population of students attending charter schools and district schools. The Coolidge, Queen Creek and Colorado City School Districts all have seen tremendous charter school growth over the past decade (see our last blog) and now roughly an equal number of students are enrolled in charter schools as district schools within these districts’ boundaries.

FIGURE 1 – 2015 ENROLLMENT (ADM) FOR DISTRICT AND CHARTER SCHOOLS IN SELECT ATTENDANCE AREAS[1]

Figure 1 shows charter and district school enrollment numbers by geographical attendance area (elementary district boundaries in this case). For this analysis, high schools–both district and charter–were mapped to elementary attendance areas because elementary districts provide a more granular frame of reference than high school district boundaries. Where districts do not have a unified system of elementary level and high school level schools, both attendance areas are noted in the table above.

The interactive map below allows us to take a closer look at the Phoenix area, examining which Valley communities have seen the greatest proportional gains in student enrollment in charter schools. The southeast Valley as a region has seen the greatest proportion of student enrollment in charter schools, with Queen Creek and Coolidge School Districts now enrolling less than half of the students attending school in their attendance areas.  That is, these districts no longer contain a majority of students (and their families) who are tied to the local school district governance and decision-making structure.

MAP 1 – PROPORTION OF STUDENTS IN CHARTER SCHOOLS BY ATTENDANCE AREA

(Click on an attendance area in the map above to see the FY2015 details)

IMPLICATIONS

Arizona, like most states, grants households with school-age children a free and appropriate public education based on the district’s boundaries in which the household is located. Additionally, Arizona law allows families the option to attend public schools of their choice (district or charter), so long as seating capacity is available and parents are able to transport their student. Despite this flexibility, school district attendance areas still serve as real and consequential boundaries for political and planning purposes as well as the taxation of households. Though district boundaries and school addresses are fixed locations, families are clearly exercising their freedom of choice within and between attendance areas. These data suggest that significant numbers of families choose to send their students to both charter and neighboring district schools rather than the default of their home’s neighborhood school district.

Why is this finding important?

When the public registers to vote they are asked to participate in governance and taxations issues related to the school district that they are assigned based on the location of their home.  Families choosing charter schools or district schools outside of their home attendance area are not afforded direct say in taxation and governance decisions for the school district or charter where they choose to send their children.  At the same time an increasing number of Arizona families are exercising the proverbial “vote with their feet” with respect to their school of choice, their voting rights are still restricted to their local school district’s elections.  The only exception applies to statewide initiatives, such as Proposition 301 and the recently passed Proposition 123, that are not restricted based on local school district affiliation.

There is a presumption (or at least a common perception) that local district elections provide for strong local control and governance because of the commitment of the voting citizenry which has historically included the voting parents of children who attended their local public schools. These voting parents have been critical to this system as they theoretically had a vested interest in directly supporting their child’s public education.


“Local investment is potentially at jeopardy given these voters no longer have a direct, vested interest in the outcome of elections on their neighborhood schools.”

These data suggest that perhaps this system of local investment is potentially at jeopardy given these voters no longer have a direct, vested interest in the outcome of elections on their neighborhood schools. In other words, school choice (in its broadest definition) decreases the number of voters with an immediate investment in the passage of the bond and override because neither the parents of open enrollment students nor charter schools have a direct benefit from passing the bond and override in their local school district. Likewise, the parents of students attending a school district via open enrollment cannot vote for a bond and override that will benefit their child directly.

It should be noted that the number of students choosing to attend other districts schools through open enrollment is presumed in this blog, and the actual count of students is not reported through existing state data sources.  Anecdotally, some districts report that they receive more than 10 percent of their students from other school districts.  In order to fully understand the impact of the state’s open enrollment statutes on school districts’ total enrollment additional data is necessary.  To date, there is no publicly available information that reports open enrollment numbers or any way to infer this information from available data.

Open enrollment to all schools (charter school and district schools) outside of home attendance areas raises questions about how Arizona citizens can best support, define and participate in the kind of school systems they choose to send their children. The free movement of the Arizona public school student body has implications for our school finance system as well as our role as citizens in the governance of our schools. With the flagging ties to local control of funds and charter schools’ complete dependence on statewide general revenue funds, it seems that reform to the school finance system that funds schools based on school district boundaries and the ability to pass local taxes is warranted.

Footnotes/References

[1] Average Daily Attendance from Arizona Department of Education. Attendance areas for charter schools were assigned using the Arizona District Locator, http://azredistricting.org/districtlocator/

For more on the policy effects of school choice, see The distance between desk and home: the policy and finance implications of school choice policies


Categories
Education Blog

NET GAINS – CHARTER GROWTH WITHIN SCHOOL DISTRICT BOUNDARIES, PART I

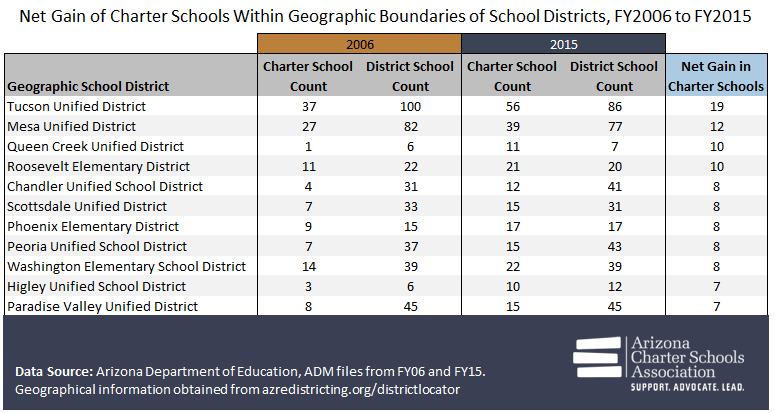
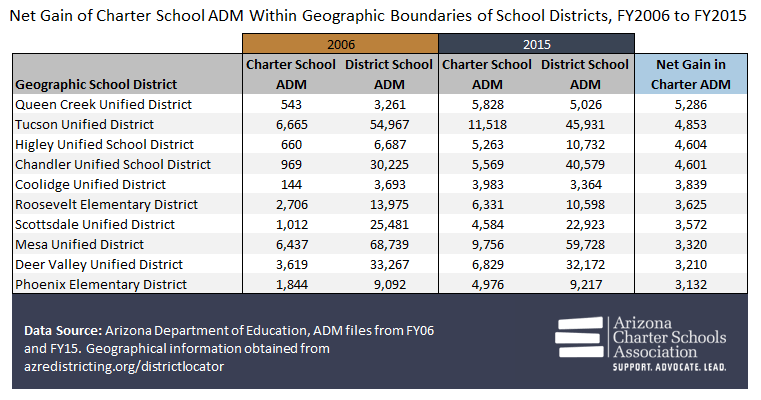
Where has Arizona’s charter school movement grown in the last decade? We found that Tucson Unified School District saw the most new charter schools within its borders, gaining 19while Queen Creek Unified School District gained the most charter students, increasing by 5,286[1].

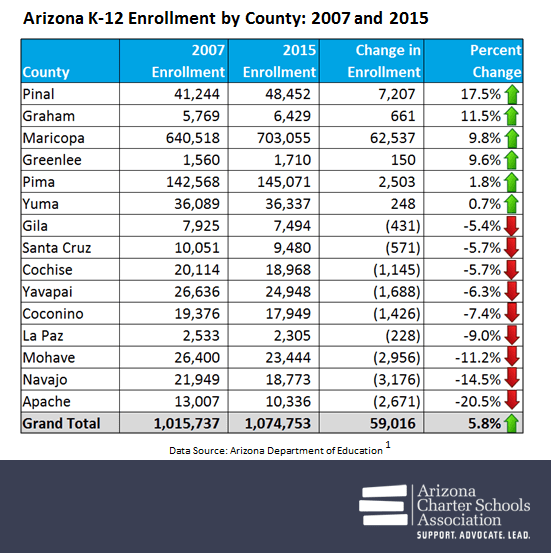
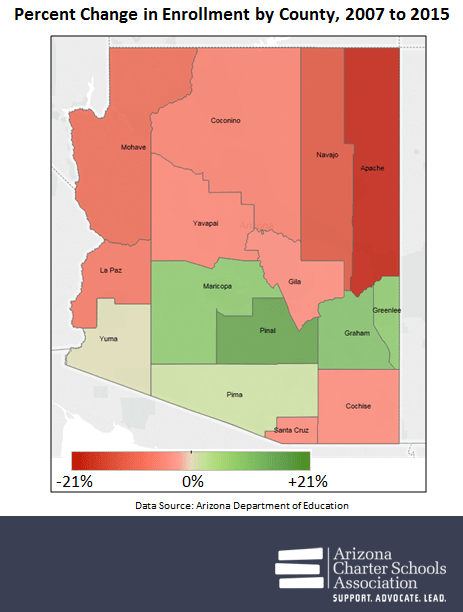
In Part 1 of our series, we analyzed the net gain of charter schools and students within school district boundaries from FY06 to FY15. In a previous blog we examined overall state attendance trends at the county level.

CHARTER SCHOOL GROWTH WITHIN DISTRICT BOUNDARIES

Figure 1 shows school districts that have had the greatest net gain of charter schools within their geographic boundaries from 2006 to 2015[2]. “Net gain” in charter schools is just that – the difference in number of charter schools within a district’s boundaries in 2006 and 2015. It is possible that any number of schools could have actually opened or closed in the years between these two snapshots in time, but in this blog we focus on the net change in the number of schools within a district attendance area.

FIGURE 1: GEOGRAPHIC SCHOOL DISTRICTS WITH LARGEST NET GAIN IN CHARTER SCHOOLS, FY06 TO FY15

Most of the net growth of charter schools has been focused in school districts surrounding Phoenix and Tucson, with Tucson Unified leading the state. Large districts in the northern and southwestern parts of the state have also seen modest net gains in charter schools within their boundaries, namely Yuma Elementary District (2), Flagstaff Unified District (2), Camp Verde Unified District (2), Humboldt Unified District (3) and Prescott Unified District (3).

Perhaps more intuitive and interesting than the table in Figure 1, though, is a look at how the net gain numbers have actually played out throughout the landscape of the state. Taking a closer look at the Phoenix area, we can examine which Valley communities have seen the greatest gains in charter schools. Mesa Unified leads the way in the Valley, gaining 12 charters from 2006 to 2015, while Queen Creek and Roosevelt had a net gain of 10 each.

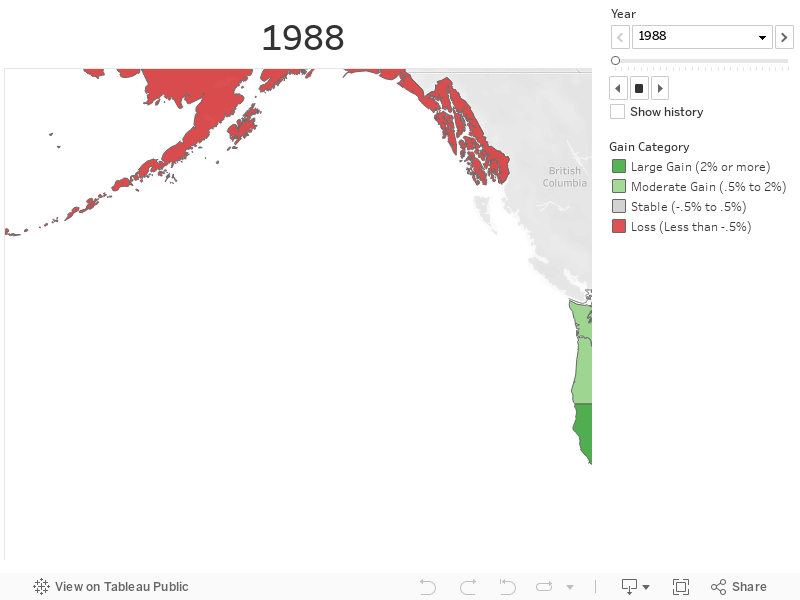
The interactive map below shows charter school net gain by school district. School districts with a net change of 0 have been excluded. Click on the markers to see the district’s net gain in charter schools.

MAP 1: NET GAIN IN CHARTER SCHOOLS BY SCHOOL DISTRICT, FY06 TO FY15

CHARTER STUDENT GROWTH WITHIN DISTRICT BOUNDARIES

In a related but slightly different question, the Association also looked at absolute net change in charter school attendance, rather than number of charter schools. Figure 2 shows the top ten school districts for net charter average daily membership (ADM) gain between 2006 and 2015:

FIGURE 2: GEOGRAPHIC SCHOOL DISTRICTS WITH LARGEST NET GAIN IN CHARTER SCHOOL ADM, FY06 TO FY15

Tucson Unified is still near the top of the list, however, cedes its number one spot to Queen Creek Unified when the question is viewed through the lens of total students rather than schools. Notably, the two districts that appear in Figure 2 that do not appear in Figure 1 are Coolidge Unified District and Deer Valley Unified District. This suggests that these two districts either added a small number of larger charter schools within their boundaries, or saw strong growth rates within the existing charter schools from 2006.

Again, to see how total charter attendance has changed the educational landscape of the state, the Association mapped the net gain or loss of charter students within all school districts. The picture was similar to that of charter school net gain. Click on the markers to see the district’s net gain or less of charter students.

MAP 2: NET GAIN OR LOSS IN CHARTER STUDENTS BY SCHOOL DISTRICT, FY06 TO FY15

Focusing on the Phoenix area’s overall net change in charter student enrollment, we see similar patterns that reflect the number of charter schools gained within each district’s geographic boundaries. Queen Creek Unified, Higley Unified and Chandler Unified are represented by blue dots on the southeast side of the Valley, while districts like Deer Valley Unified and Peoria Unified can be seen on the northwest end.

SCHOOL IMPLICATIONS

Just as the past decade of overall K-12 growth in Arizona paints a misleading picture of certain counties with declining enrollment trends, the growth of charter schools and students over the past decade should be understood at a finer level than simply the evaluation of statewide trends. As our state grows in population, the growth of our public schools should meet the needs of families. Policy makers should consider enrollment trends, geography, demographics, and community needs in making K-12 policy decisions.

In our next blog, the Association will take a closer look at the charter landscape within districts. In it we will evaluate charter student market share within traditional school district attendance boundaries. This analysis will highlight those districts that are saturated based on the number of schools as well as the number of charter students and how these districts have changed over time.

FOOTNOTES/REFERENCES

[1] This blog is part one of a larger series which will focus on Average Daily Membership trends and snapshots as they relate to the geographic boundaries of a school district. This blog will primarily focus on total gains (“absolute” terms), rather than consider the increases in terms of a percentage of existing ADM or existing number of schools (“relative” terms).

[2] Schools that do not serve students in a typical fashion in a geographical location have been excluded.  In the case of district schools, the Association used state ADM data gathered at the school and district level. In the case of charter schools, the Association gathered geographical information for all charter schools that are currently open, and assigned them to a geographical school district. For certain types of schools that do not have a geographical location listed with ADE, or whose ADM trends are outside the scope of this blog, data were excluded (such as select online schools, JTEDs, accommodation/transportation schools and select BIA schools). Also, there were 11 total charter schools that existed in FY06 but not in FY15, and these were excluded from the geographical analysis.

Additional Note: The Association also created printer-friendly maps that give an overview of which school districts in the state have seen the most charter school growth within their boundaries. Download our PDF of charter growth in school districts HERE.

Categories
Education Blog

FROM POVERTY TO POLICY: FREE AND REDUCED LUNCH POPULATIONS IN ARIZONA

The Association reviewed the poverty rates of Arizona students over the past six years, and we found that a greater percentage of students are enrolled in schools with higher concentrations of poverty.

In addition to a statewide analysis, the Association analyzed the results by school type (charter/district). The most striking difference between the two groups is the disparity in the percent of students who are enrolled in a school with no free or reduced lunch (FRL) data.

Introduction

There is near universal agreement that students from low income families are more likely to struggle to meet and exceed academic expectations in school. Challenges such as the lack of resources at home, home or food insecurity, lack of books and other learning tools, and stressed or unavailable parents, can all contribute to educational difficulties of impoverished students. The National School Lunch and Breakfast Program exists to mitigate the effect of hunger on learning[i]. For the 2015-2016 school year, a student whose family income falls below 130% of the federal poverty line qualifies for free meals. For a family a four, the threshold is $31,525[ii].  A family of four below 185%, or $44,863, qualifies for reduced-priced meals.

The Analysis

Although not a perfect measure of poverty, the percent of students in a school who qualify for the FRL program is the only proxy currently available to measure the level of poverty and corresponding instructional needs in a school. The Association used FRL data available through the Arizona Department of Education[iii] to analyze the distribution of students living in poverty among Arizona schools and changes in the distribution from 2010 to 2016.

The figure below shows the distribution of Arizona’s students eligible for free or reduced-priced lunch in 2010 and 2016.  Each bar represents the percent of total student enrollment in the given FRL range. For example, in 2010, 3.8% of all Arizona students were enrolled in a school with 0 to 9% FRL; in 2016 that percent was about the same (3.7%).  The concentration of poverty in a school is demonstrated by the percentage of students eligible for FRL enrolled in the school.

The degree of poverty increases from left to right; therefore, the farthest range – 90 to 99% – represents the most concentrated poverty, where nearly all students are eligible for assistance. The exception is the rightmost bar, which indicates the percentage of students enrolled in a school that does not have FRL data. Schools that do not participate in the program do not generate any data. There are varied reasons why a school might not participate in the program and exploring those reasons is outside the scope of this blog; here we will focus our attention on the trends for those schools that do report.

Statewide, we can detect a shift of the distribution to the right, meaning that a larger percentage of students are enrolling in schools with higher concentrations of FRL students. Beginning with the low-poverty schools, both the 0 to 9% and 10 to 19% schools have a relatively unchanged percentage of students.  Schools saw declines in the percentage of students they enroll in the 20 to 29%, 30 to 39%, 40 to 49%, and 50 to 59% ranges. These students moved to the right of the distribution, into the 60% or more ranges. Combined, schools with 50 percent or more of their students eligible to receive FRL enrolled 53 percent of Arizona’s student population in 2010 and 55 percent in 2016.

In addition to a statewide analysis, the Association analyzed the results by school type (charter/district). The most striking difference between the two groups is the disparity in the percent of students who are enrolled in a school with no FRL data. As shown below, a majority of charter students are enrolled in a school that did not report FRL data in 2010 or 2016, however, very few students in district schools are enrolled in a school with no FRL data.

Given that FRL information for over half of the students enrolled in charter schools is not available, charter results must be interpreted very cautiously. For those charter schools that do report FRL data, the distribution is moving slightly to the right. In 2010, 32 percent of charter students were enrolled with 50 percent or more FRL; in 2016, this grew to 33 percent.

The results for districts schools are consistent with the statewide trend. From 2010 to 2016, a greater percentage of students are enrolled in schools with higher concentrations of poverty, despite variability in the individual ranges. In 2010, over 55 percent of district students were enrolled in schools with 50 percent of more FRL; in 2016, this grew to 59 percent.

The Implications

Higher levels of poverty in our public schools translate to higher demands of our educators and on our limited resources. If the challenges to students and demands placed on schools increase as overall resources decrease, then the challenge for schools is multiplied. Recruiting and retaining high quality teachers, for example, becomes even more difficult at the same time that the need for them becomes even more critical to student success.

As the state looks to revamp its school accountability and funding systems, the relationship between poverty and measures of achievement must be properly addressed. School accountability labels that can be largely predicted based on the FRL rate do a disservice to the very schools with the biggest challenges[iv]. Our state funding and accountability policies should reflect the real challenges presented to schools serving students in poverty.

Additionally, any policy that takes poverty into consideration must examine how to deal with the significant lack of FRL data in the charter sector. This may include the need for additional data collection or information gathering before a policy can be effectively and appropriately implemented.

A Note on Data

Although determining why charter schools do not participate in the National School Lunch and Breakfast Program is outside of the scope of this blog, finding out the reasons may be important as the state moves forward with its K-12 funding revamp.

Footnotes/References

[i] http://www.azed.gov/health-nutrition/nslp/
[ii] https://www.gpo.gov/fdsys/pkg/FR-2015-03-31/pdf/2015-07358.pdf
[iii] http://www.azed.gov/health-nutrition/frpercentages/
[iv] See the Association’s paper, School Ratings: Improving the Data in Data Driven Decision Making, for a full explanation and recommendations.

Categories
Education Blog

Oh, the Places They’ll Go: Charters and County Choice

Arizona charter student enrollment has increased from nine percent of all Arizona students in 2006 to 15 percent of students in 2015, an increase of nearly 74,000 students.  Given the significant growth in the charter sector, most counties saw an increase in the total number of students enrolled in charter schools. However, not all counties grew their charter populations at the same rate.

The table below summarizes district[1] and charter school enrollment in each county, sorted by county enrollment size, from largest to smallest.

Since enrollment trends in charter schools parallel county enrollment trends to some extent (see our March blog), one might expect that county size would impact charter enrollment, i.e., counties with fewer students enrolled would have fewer charter schools and vice versa.  However, this doesn’t appear to be the case across Arizona.

Take for example Cochise and Coconino Counties, two mid-sized counties with total student enrollment just under 20,000. Despite similar total enrollment in both years, Coconino County saw significant growth in charter enrollment by doubling its charter student enrollment to 16 percent. At the same time, Cochise County saw charter enrollment increase slightly to 12 percent. Yuma County, however, the state’s fourth largest county, enrolls only eight percent of its students in charter schools, slightly half of the state average.

Most counties saw an increase in the total number of students enrolled in charter schools. However, not all counties grew their charter populations at the same rate. In order to gauge the rate of charter growth in each county, we calculated the difference in charter enrollment from the state average for each county in both years.

When considering relative charter enrollment, even counties like Cochise and Coconino that saw enrollment increases in the total number of students saw their relative proportion of the state’s charter enrollment impacted. Coconino County mirrors statewide charter enrollment, while Cochise County’s charter growth has been slower[2].

County Statistics:

  • Largest Percentage of Charter Students: Maricopa County – In 2015, charter students made up 16 percent of the student population of Maricopa County, slightly above the state average, similar to results in 2006. This suggests that charter growth in Maricopa County reflects statewide charter growth (given its size, this is not surprising).
  • Fastest Growth of Charter Students: Pinal County – Consistent with our March 2016 blog showing Pinal as the fastest growing county, it also has the fastest rate of growth in charters. In 2015, 11 percent of students are enrolled in charter schools, only four percentage points below the state average, compared to 2006, when only three percent of its students were enrolled in charter schools.
  • Fastest Decline of Charters: Navajo, Apache and La Paz Counties –
    • Navajo County enrolled eight percent of its students in charter school in 2006, just under the state average. By 2015, however, only three percent of students are enrolled in charter schools.
    • Apache County, charter enrollment declined from two percent in 2006 to nearly zero percent in 2015[3].
    • La Paz County now has no students enrolled in charter schools, compared to four percent of its enrollment in 2006.
  • No Charter Students: Greenlee County – Greenlee did not enroll any charter students in 2006 or 2015.

Our state school choice policies are built on the assumption that school choice and access to charter schools is desirable for all students no matter where they live in the state. These data show that such access and opportunity is not equally available to all students. This snapshot of two points in time suggests dynamics are at work within each county that either encourage or discourage enrollment in charter schools. Further work is needed to identify what those dynamics might be and whether or not these can be (or should be) addressed to provide access to choice across Arizona.

Footnotes:

[1] Joint Technological Education District enrollments are not included.
[2] Coconino’s 16 percent charter enrollment, which doubled from 8 percent in 2006, is just slightly above the state average. Cochise’s 12 percent charter enrollment, which is up from 10 percent in 2006, is still three percentage points lower than the state average charter population.
[3] The only charter school in Apache County in 2014-2015 closed for the 2015-2016 school year.

Categories
Education Blog

Oh, the Places They’ll Go: Enrollment Trends Since 2007

The Association’s first look at statewide enrollment trends over the last nine years shows that despite the overall growth in K-12 enrollment, nine of the fifteen counties in the state have seen an overall decline in student enrollment.

Perhaps not surprisingly, Maricopa County saw the greatest increase in the number of students, adding 62,537 students. In terms of percent change, Pinal County outpaced Maricopa County, increasing by 17.5%, or 7,207 students. Two of the state’s smallest counties, Graham County and Greenlee, also top the list of percent growth at 11.5% and 9.6% respectively.

When we consider the “percent change” column of the above table with a geographical lens, we get a clearer picture of Arizona’s enrollment patterns. The map below shows that the largest enrollment declines are occurring in the northern part of the state, with Cochise and Santa Cruz counties being the exceptions to this trend:

The implications of such enrollment trends are not insignificant. Statewide comparisons, independent of county-specific analyses, paint a positive, growing K-12 environment. As the overall population of students in the state increases, so does our overall K-12 budget allocated from the state’s general fund. However, simply evaluating statewide trends provides an incomplete picture of student enrollment trends that may result in ineffective policy decisions. Evaluating these data by county is pivotal in understanding how enrollment has changed across our state. For example, the declining enrollments in rural counties result in declining school and district budgets, making it even more difficult to find qualified teachers in these counties. Also, as enrollment increases in Maricopa and Pinal Counties, the demand for school facilities will grow while at the same time buildings in Northern Arizona become underutilized.

It is clear from these data that student enrollment patterns vary significantly by county and this will likely complicate future discussions regarding budget, facilities and access to high quality schools. Arizona’s education policy discussions should not assume enrollment growth is occurring statewide. Instead, policymakers would benefit from reviewing differing enrollment patterns across different parts of the state and consider the impact on proposed policies.

Categories
Education Blog

Special Education Funding Matters to All Students – SPED Series, Part I

One in forty boys in Arizona is diagnosed with an Autism Spectrum Disorder[1]. This statistic and others indicate a growing population of students with special needs in our schools.  Given this, it’s not surprising that policy makers, teachers, and advocates have been calling for additional supports for students with special needs. The Governor’s Classrooms First Council has taken up this call during its discussions of Arizona’s school finance formula.

The Classrooms First Council released their preliminary recommendations[2] in September. The recommendations represented significant consensus among the Council in three key areas: equitable funding, student-centered learning priorities, and recognition of excellence. Two key student-centered learning priorities recommendations received wide spread support: (1) fund special education students according to the 2007 cost study and (2) fund the existing “Extraordinary Special Needs Fund” to address high-cost students for all public schools. These recommendations were made while recognizing additional new dollars would be needed for implementation. The 2007 cost study demonstrated that $144.8 million[3] in additional funding would be needed just to fund expenses; adjusted estimates based on an inflator formula put these dollars closer to $400 million today. These estimates do not address the funding of the Extraordinary Special Needs Fund.

Given the strong support for these two recommendations, the Association set out to analyze special education funding data to determine the magnitude and potential impacts of these recommendations.  The findings of our analyses will be released throughout the next months. The first in this series presents longitudinal trends in special education enrollment as well as current student enrollment data by disability type and severity and addresses the first policy recommendation of the Council.

The Findings

The first policy recommendation — fund the 2007 special education cost study — appears to be straightforward. Our analysis of current special education data indicate that the impact of this recommendation is likely significantly greater than initial estimates. Initial estimates indicated that the gap (in 2007) was $144.8 million in additional funding. However, that estimate was based on 2006-07 enrollment data, which indicated a statewide total special education student enrollment of 117,095.78[4]. National Center for Education Statistics data reported for the same time period indicates that statewide special education student enrollment for the same time frame was 124,019; this 6% difference is a significant underestimation of students in the initial cost study. Analyzing the longitudinal trends from 2006-07 to 2013-14 indicates that Arizona’s special education population has increased by 5% (see table).

Given the increased special education population demonstrated in the longitudinal analysis, it’s reasonable to believe that the initial cost estimates will need significant adjustments to account for the current special education enrollment. These adjustments are necessary to appropriately fund services designated in students’ Individualized Education Plans (IEPs), as these expenditures are legally required and services are federally protected. This is true regardless of how much K-12 funding the state provides.

As a result, school districts and charters are forced to make untenable decisions regarding the allocation of tight resources. Since special education services must be delivered, no matter the amount of statewide education funding, school districts and charters must pull resources from the 88 percent of students who are not designated to receive special education services.  Alternatively, the under-funding of special education creates dis-incentives to properly identify, serve and support these students. Neither of these options supports our students.

This is the first blog in our Special Education Funding series. Part II can be found here, and Part III can be found here.

Footnotes/References

[1] http://www.cdc.gov/ncbddd/autism/states/addm-arizona-fact-sheet.pdf
[2] Classrooms First Council Recommendations http://education.azgovernor.gov/sites/default/files/cficpreliminaryframework9-22-15revisedv4.pdf
[3] Classrooms First Council presentation on special education funding http://education.azgovernor.gov/sites/default/files/8-27_sclp_presentations_all.pdf
[4]2007 Special Education Cost Study www.azed.gov/special-education/files/2011/06/specialeducationcoststudy2007.pdf, the cost study utilized Average Daily Membership (ADM) which results in portions of student funding, hence the 117,095.78 figure used.
[5]
 NCES data U.S. Department of Education, National Center for Education Statistics, Common Core of Data (CCD), “Local Education Agency (School District) Universe Survey”, 2006-07 v.1c,  2007-08 v.1b,  2008-09 v.1a,  2009-10 v.2a,  2010-11 v.2a,  2011-12 v.1a,  2012-13 v.1a,  2013-14 v.1a; “State Nonfiscal Public Elementary/Secondary Education Survey”, 2013-14 v.1a.

Categories
Education Blog

Charter Student Enrollment Increases

Despite a tumultuous legislative session that had significant impacts on charter schools, charter student enrollment continues to rise. Initial estimates indicate that an additional 10,000 students attend a charter school this year, which is a 6.3 percent increase.

During the 2015 session, the Arizona Legislature passed two significant policies directly impacting charter schools – policies that may have impacted student enrollment. The state now funds charter schools based on the total number of students in a “network,” or groups of affiliated schools. These charter school networks are now treated, for the purpose of funding, similarly to traditional school districts. Additionally, the Legislature made significant changes to district sponsored charter schools in FY2015, requiring most to revert back to traditional district status.

The number of unique charter organizations dropped from 267 in FY15 to 250 in FY16, due in large part to the State Board of Charter Schools closure of 27 campuses as well as the 59 districtsponsored charter schools the Legislature forced to revert back to traditional district status.

In our June 2015 blog, we introduced you to Arizona’s largest charter organizations. Table 2 shows these charters with their updated FY2016 data.  While the organizations in the top 10 remained stable from 2015 to 2016, the composition of the list changed significantly. The top two charter networks, Great Hearts Academies and Basis Schools, both experienced substantial enrollment increases, with Basis Schools taking the top spot.

The ten largest charter organizations enroll nearly 41 percent of all charter students. Charter market share for the two largest networks increased to 12 percent in FY16. The table also shows the relative ranking of charter organizations based on their share of charter student enrollment.  The majority of the rankings were impacted by these initial FY16 estimates: 6 out of 10 school networks shifted their relative positioning within the ranking.  These results continue to indicate that enrollment patterns within the state’s largest charter networks vary.

For charter school supporters, these data are heartening given the impacts of the 2015 Legislative session on charter schools. For supporters of increased access to quality school options, these data also provide evidence that Arizona’s highest performing charter networks are continuing to increase their impact and represent a significant population of Arizona’s charter student enrollment.