While it is an urban myth[i] that prison population projections are based on the number of third graders that cannot read — a connection exists between incarceration and failure to read. A student not reading by the end of third grade is four times less like to graduate, and high school dropouts were 63 times more likely to see the inside of prison walls than college graduates[ii].
In an effort to combat those statistics, the state’s Move on When Reading (MOWR) law[iii] requires schools to retain third-graders who fall far below reading standards.
With 44 percent of our third graders scoring “minimally proficient” on AzMERIT, it was surprising that in August the Arizona State Board of Education set the bar based on past exam levels, allowing only three percent of Arizona’s third-graders mandated access to “intervention and remedial strategies.” Despite test results demonstrating more of our students lack the skills to graduate high school, the State Board set a policy that keeps the bar low for the 2015 and 2016 administrations of AzMERIT.
So…Why Does it Matter?
Arizona’s measures for determining the academic preparedness of our students have long differed from external measures, namely national assessments. In the 2013 AIMS results, 77% of fourth and 72% of eighth grade students were proficient in reading; however, the 2013 National Assessment of Educational Progress (NAEP) results show that 72% of Arizona fourth- and eighth-graders were NOT proficient in reading, compared to 66% of students nation-wide. As our students matriculate to high school, we see the ramifications of these results: 25% of Arizona students do not graduate from high school with their class, according to statistics from the Arizona Department of Education.
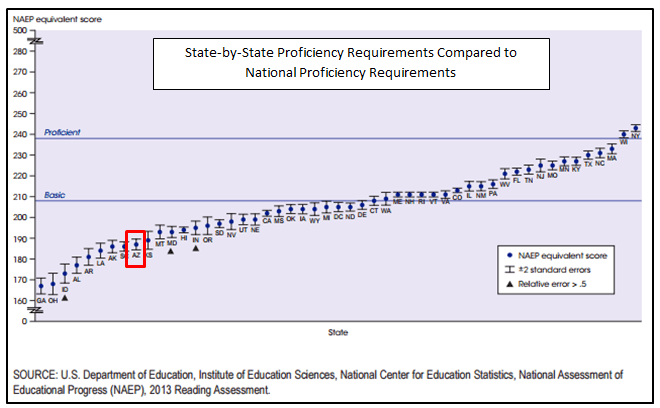
How is it possible to have such differing diagnoses from the state and national exams? The 2013 NAEP Mapping Study[iv] demonstrates the disparity. The following chart represents the alignment between NAEP expectations and state proficiency expectations in reading. It is clear that Arizona’s AIMS proficiency standard is significantly lower than both the NAEP Proficient and Basic cut scores. The chart also illustrates how it is possible for students identified as proficient on AIMS to simultaneously score well below the Basic level on NAEP.
In response to these facts, Governor Doug Ducey[v] communicated the following during his remarks to the State Board of Education in March:
“First, Arizona’s scores are too low – unacceptably low. Second, we’re giving false assurance to too many parents that their kids are well-prepared for life or college — when in fact they are not. So we need to commit ourselves to achieving excellence. And when we see excellence, we should understand who and what creates it and export those best practices to other schools so that they can benefit from it.
This Board – along with my office and the Legislature – needs to design policies that get Arizona on a path to significant improvement in the quality of education. It won’t happen overnight, and it’s a long-term proposition, but it can be done and we need to make that our primary focus.”
The State Board developed policies in response to this call to action. The Performance Level Descriptors adopted by the Board and used extensively by teachers during standards-setting established high expectations for proficiency that were critical to beginning to align our state’s outcomes to national measures, and furthermore, to prepare Arizona students for college or career. According to the Department’s materials, the AzMERIT performance standards are generally comparable to the performance standards on NAEP.
It was widely acknowledged throughout the standards-setting process that teachers understood that students taking the exam in 2015 were not prepared or ready to meet the higher standards, yet teachers recommended appropriate standards anyway. Dr. Joe O’Reilly, an external observer and school district employee, presented his observations regarding the standards-setting process and teachers’ commitment to educational excellence in his memo to the Board:
“Teachers took their training to heart. We heard them say things to each other like ‘I want to make sure we are setting it at college and career ready, not too low, not where a student is not really college and career ready.’ They also discussed why the results turned out as they did and said things like ‘we are setting this for what we want students to be able to do, not what they can do now,’ ‘that [item’s results] is a teacher issue and where the teacher is on the new standards,’ and ‘that should be an easy item if it was taught properly.’ ” (P. 3)[vi]
Our state’s past academic results along with the overwhelming acknowledgement by educational professionals, parents, policymakers, and the business community contributed to the Board’s decision to establish higher, more rigorous standards for AzMERIT on August 14, 2015.
So…How Did This Happen?
Why, despite the Board’s prior moves to rigorous expectations, did the Board take a step backwards towards old expectations and performance standards? A.R.S. §15-701 required them to set the cut score using “reading scores.” Alternative recommendations to set it at the Minimally Proficient level, using the English Language Arts (ELA) scores, were dismissed due to this interpretation. Unfortunately, the Department didn’t provide an alternatively rigorous reading score, one that might have aligned more closely to the Minimally Proficient level, for the Board to consider. Simply put, the Board was left with only the AIMS equivalent cut score as an option.
In an attempt to ameliorate their decision, to revert to lower standards and old expectations, the Board approved a measure that would avoid providing confusing information to parents of existing fourth graders. Students impacted by the Board’s decision are still eligible for remediation support, despite being promoted, so this information will be provided to schools only with the expectation that students receive interventions during the 2015-16 school year.
The Board also acknowledged that the approved cut scores don’t reflect the level of rigor and expectations for reading and are inconsistent with their previous decisions to set high expectations for passing on AzMERIT. Their motion required the Department to reconvene a standard setting committee to provide a recommended “falls far below” level for subsequent years that is in alignment with the AzMERIT expectations. Lastly, the Board will seek additional legislation regarding Arizona’s Move on When Reading statute to align it with the current statewide assessment, specifically the use of an English Language Arts assessment.
So…What Does This Mean?
Although a majority of Arizona fourth- and eighth-grade students were deemed “proficient” in reading in the 2013 AIMS results, these same students fell far short of expectations for proficiency on the national exam (NAEP). Expectations vary state-by-state, and in many cases, individual states’ expectations fall short of the requirements of the national exam – Arizona is one of these states.
In March, Governor Ducey called for action to raise the state academic standards to more closely align with national standards, and to better prepare Arizona students for college and career. The State Board has responded, developing curricula requirements and implementing assessments that match the performance standards of the NAEP.
Despite these advances, third graders in 2016 will be passed on at the same rate as their predecessors who were subjected to lower standards and expectations. This slow transition to a more rigorous standard in 2017 will mean thousands of children will be duped into thinking they are on track for college and career when they are not.
Footnotes/References
[i] http://www.theatlantic.com/business/archive/2012/07/an-urban-myth-that-should-be-true/259329/
[ii] http://readingpartners.org/blog/do-prisons-use-third-grade-reading-scores-to-predict-the-number-of-prison-beds-theyll-need/
[iii] A.R.S. §15-701 http://www.azleg.gov/FormatDocument.asp?inDoc=/ars/15/00701.htm&Title=15&Doc
[iv] Bandeira de Mello, V., Bohrnstedt, G., Blankenship, C., and Sherman, D. (2015). Mapping State Proficiency Standards Onto NAEP Scales: Results From the 2013 NAEP Reading and Mathematics Assessments (NCES 2015-046). U.S. Department of Education, Washington, DC: National Center for Education Statistics. Retrieved 8/18/15 from http://nces.ed.gov/pubsearch.
[v] http://azgovernor.gov/governor/news/governor-duceys-remarks-arizona-state-board-education
[vi] August 14, 2015 agenda materials https://azsbe.az.gov/public-meetings