Categories
Education Blog

HOW THE DATA TEAM SPENT OUR SUMMER VACATION

As summer draws to a close in Arizona — by definition, at least, if not by temperature — the Research Team at the Association looks back on some of their data work and the bountiful harvest of data visualizations the work yielded. If you spent any time this summer chillaxing by an ocean or exploring in the mountains, we are jealous. Also, you may have missed some pretty good data tools and impactful research. Here is summary of the basics to catch you up, along with hyperlinks to the relevant work.

Myth Buster Series on Student Migration — This three-part series presented new statewide data that shows that public charter schools do not “cream” the best students from districts, and alternative schools are not necessarily the last resort for students.

Quality Schools Landscape Analysis Tool — This dashboard puts 2018 A-F school ratings into the Quality Schools Framework and contextualizes the results with census family income data. All letter grade appeals have been reflected in this tool, as of January 17, 2019.

National Assessment of Educational Progress (NAEP) Dashboard — This visualization gives users a way to compare all statewide NAEP data for 4th and 8th grades in Reading and Mathematics for all states since the inception of statewide NAEP in the 1990s.  Oh yeah, you can also compare the performance of public charter schools as a group for each state as well.

2015 to 2018 AzMERIT State Results and Disaggregation Dashboard — This dashboard reports all state-released information on AzMERIT from 2015 to 2018. Users can disaggregate data by subgroup, sector, grade, and geographical groups such as legislative districts and cities.

2015 to 2018 AzMERIT School-level Results Dashboard — A companion dashboard to the “State Results” Dashboard, this visualization allows users to drill into school-level AzMERIT data from 2015-2018. Find your school and track its results for the past four years.

2018 AzMERIT Pass Rates, Percentile Ranks, and State Ranks — If you are only interested in how your school did on the 2018 AzMERIT (rather than a more historical perspective), then this dashboard can help. Filter schools by city, National School Lunch Program participation, sector, and other characteristics. All schools are assigned a state rank and percentile rank based on 2018 performance.

As we settle into autumn, look for 1) updates to each of these tools, 2) future work on student mobility measures in Arizona, and 3) a 2018 letter grade accountability dashboard, along with other projects. Have an idea for a future analysis or visualization? Email kelly@azcharters.org.

Categories
Education Blog

GO WEST, YOUNG STUDENTS: ARIZONA’S GROWTH SINCE THE 80’s

Most Arizonans know that the state has experienced rapid growth over the past several decades. With 1.1 million students, Arizona’s public school population was the 13th largest in the nation in 2015, the most recent year reported.

But just how quickly have student populations risen, relative to other states?

We found that Arizona’s K-12 public school population more than doubled from 1987 to 2015, according to recently released data from the National Center for Education Statistics. Only Nevada saw a larger percentage gain in students during that time period, while the nation as a whole experienced a 27 percent growth in its K-12 student population.

The table shows the top five states in terms of relative growth, along with the national totals. Click on the bar graph for a better view of each of the 50 states, and Washington D.C.

Public School Student Population Growth: Top Five

Public School Student Population Growth Since 1987: All 50 States


Most of Arizona’s growth occurred from 1987 to 2006, a nearly twenty year span when the state averaged a 3.6% annual gain in student population. Since then, the student population has remained stable at around 1.1 million students.

The visualization below shows a year-by-year look at how student populations have grown in each state. Use the “Year” filter on the right to toggle through various years and see how the student population ascended or declined in a given state that year. For best results, click the “full screen” icon at the bottom right of the tool.


Footnotes and References

Source: U.S. Department of Education, National Center for Education Statistics, Common Core of Data (CCD)

Categories
Education Blog

ARE DISTRICT ATTENDANCE ZONES OBSOLETE?

By Kelly Powell and Ildi Laczko-Kerr

A new study[1] that examines student enrollment patterns in Maricopa County found that about 37 percent of district students participate in open enrollment. Given that Arizona school choice options also include public charter schools, the Center for Student Achievement expanded the findings[2] to include charter enrollment data for the attendance zones sampled in the study. This new analysis finds that nearly 50 percent of all students in these attendance zones do not attend their assigned district school. These combined data suggest that traditional school district attendance zones are becoming obsolete.

The chart below shows the percentage of students in the studied attendance zones whose families are choosing a school other than their assigned district school, broken out by district and charter attendance.

Percentage of Total Students NOT Attending Assigned District Schools

ABOUT THE DISTRICT STUDY

Though the study was limited[3] to nine school districts in Maricopa County, the authors’ spatial analysis painstakingly mapped student addresses and school boundaries for about one-third of district elementary school students in the county. The authors restricted their analysis to the elementary grades (K-8) in the 2016 school year. These grades collectively serve over 130,000 students. Students were considered “open enrolled” if they attended a district school outside of their attendance area, including within-district (students attending another school in the same district) and between-district (students attending school in another district) open enrollment.

The impact of within- and between-district open enrollment is striking. Not including charter student enrollment, results ranged from 15 percent to as much as 57 percent of the student population choosing to utilize open enrollment.

SCHOOL CHOICE IN MARICOPA COUNTY

When the Center for Student Achievement combined charter enrollment[4] for charters located within the study’s attendance zone, we found that 47 percent of students attended a school other than the one to which they are assigned based on home address. In one sampled attendance zone, as many as 81 percent of students participated in school choice.

Counts by School Choice Option in Nine Maricopa County Attendance Zones

THE NEW NORM

This analysis points to significant community demand for school choice, given the number of students opting to attend a district school other than the one to which they are assigned, coupled with the high percentage of students attending public charter schools.

Given this analysis, Arizona policymakers should take into account the widespread use and popularity of school choice at the local and state level when developing education policies and making budgetary decisions.

References and Footnotes

[1]State of Open Enrollment in Maricopa County Oct 26th” manuscript by Matthew Hom and Patrick Cizek, October 26, 2017.

[2] The authors provided matched charter school K-8 enrollments within their sample of attendance zones.

[3] Besides limiting the number of participating Districts, the authors limited their analysis to the elementary grades. Their rationale to limit the analysis to K-8 was based in the fact that mobility patterns seemed to differ significantly in elementary and secondary levels, and without corresponding high school data for participating elementary districts, results would be difficult to interpret.

[4] An additional 25,503 students enrolled in charter schools located in the attendance zones of participating districts were included in the analysis. Enrollment counts were from the 2016 school year and were limited to kindergarten through grade 8 for “brick and mortar” schools. Online schools were not included in charter counts.


Categories
Education Blog

2017 AzMERIT INTERACTIVE DASHBOARD – HOW DID YOUR SCHOOL DO?

If you are one of the many Arizonans wondering what to make of last month’s release of the 2017 AzMERIT results, then the Association’s school-by-school dashboard will help to provide meaningful context. The dashboard ranks each school in Arizona based on overall pass rates in Mathematics and English Language Arts, and results can be filtered by city and free and reduced lunch rate. Click the image to see the full interactive dashboard.

HOW TO USE THE DASHBOARD
  • Each icon on the scatterplot represents a school. Hover over an icon to see more information about the school, such as its district/charter holder, its overall pass rate on the ELA or Math exam, or its state rank based on those pass rates.
  • Use the sliding filter for FRL to examine schools by their reported Free and Reduced Lunch rates. Use the clickable “Sector” and “Alternative” filters to toggle charter schools/district schools, or alternative/traditional schools. The scatterplot icons as well as the lists at the bottom of the dashboard will update to include only the schools that are within the parameters of the filters.
  • Use the “City” filter to see only the schools that are within a certain city. The scatterplot icons as well as the lists at the bottom of the dashboard will update to include only the schools that are within the given city.
METHODOLOGY
  • This dashboard assigns each school in the 2017 AzMERIT file to a city, based on that school’s physical address.
  • Ties in pass rate resulted in the same ranking being assigned to each tied school, and subsequent schools being ranked based on how many schools were tied in the group ahead of them. Example: If the top five schools in the state were tied for first with a 90% pass rate, those five schools would all be assigned a ranking of “1st”, while the school or schools with the next-best pass rate in the state would be assigned a ranking of “6th”.
  • The pass rates of schools with fewer than 11 students tested were redacted from the state file. Such schools were not included in the rankings, and are not shown in the scatterplot, as they do not have reported pass rates for ELA or Math.
  • Some schools have pass rates listed as as “>=98%” or “<2%” in the state-released file. Such schools were coded with pass rates of “99%” and “1%”, respectively, and included in the rankings. This small adjustment in the reported pass rates is the reason why the x- and y-axes are listed as “Math Pass Rate Proxy” and “ELA Pass Rate Proxy”.
  • Free and Reduced Lunch rates are sometimes reported to ADE as ranges, such as “40-49%”. Such reported FRL rates were recoded with an “FRL Proxy” that is a number, such as 45%. Additionally, several schools in the state do not report FRL rates. These schools were assigned an FRL Proxy of 0%.
Categories
Education Blog

ARIZONA EIGHTH GRADE MATH PERFORMANCE – A MORE COMPLETE PICTURE

By Dr. Ildi Laczko-Kerr and Kelly Powell

This past fall, when the statewide results of the 2016 AzMERIT exam were published, the eighth grade math test pass rate was pegged at 26 percent. Though this figure is true for the students who took the general eighth grade math exam, it does not represent all eighth grade students in Arizona, because many students take advanced math classes and therefore take a different exam.

In the chart below, the percentage of eighth graders who took a high school “end of course” exam, such as Algebra I, Geometry, or Algebra II instead of the general eighth grade math test are reported.

PERCENTAGE OF EIGHTH GRADE STUDENTS TESTED BY TYPE OF MATH TEST
These data indicate that in 2016, almost one out of every five eighth grade students is accelerated in math and taking a high school end of course math exam. The impact on state reporting is significant: nearly 20 percent of eighth graders’ test results were not accounted for in the reported 26 percent pass rate. Taking all math test results into consideration, the overall math pass rate for eigth graders is actually 36 percent. This represents a 10 percentage point increase from the publicly reported eight grade results, and a 2 percent increase from 2015 when all eighth grade students were required to take the eighth grade math exam.

OBSERVATIONS ABOUT ACCELERATED STUDENT PERFORMANCE

The 2016 data show that the majority of advanced math students are accelerated by one course, e.g. Algebra I instead of eighth grade math. Smaller percentages of students are accelerated by two (taking Geometry) or three (Algebra II) courses. However, the average performance of the accelerated students increases significantly the more the students are accelerated. In other words, students who are three times accelerated (taking high school Algebra II in 8th grade) are passing at 92 percent compared to the 78 percent of students accelerated by one course, Algebra I. Students who are accelerated at this rate can certainly be called exceptionally advanced in math and don’t reflect the typical middle school math experience.

PERCENTAGE OF EIGHTH GRADE TESTERS PROFICIENT IN MATH

WHY DOES THIS MATTER?

Researchers, teachers, education advocates and others agree that eighth grade math is a critical indicator of success in high school and college (as well as in career and life). In fact, the Arizona Education Progress Meter, which represents key metrics that support a shared vision for world-class education in our state, includes eighth grade math as one of eight indicators by which to measure the health of education in Arizona.

Arguably, improving the percentage of eighth grade students proficient in eighth grade math is its own laudable goal. Even better, having more students pass high school level content (Algebra I and II and Geometry) in middle school would open them up for advanced studies later in school, and prepare them for more training or education beyond high school. In order to monitor Arizona’s progress towards these goals, we should: encourage any programs or initiatives that address early identification and interventions for students struggling in math (no matter the level) and measure and report the math performance of all eighth grade students, no matter the test they take.

Categories
Education Blog

THE ALGEBRA OPTION IN ARIZONA

By Kelly Powell

Governor Ducey identified proficiency in algebra skills by the end of eighth grade as a strategic goal for Arizona to ensure a world-class, 21st century education in his “Education Matters Arizona” initiative. But according to 2014 data, Arizona ranks 37th in the percentage of students in seventh and eighth grade enrolled in an Algebra class.

According to data from the 2013-14 Civil Rights Data Collection and 2014 Common Core of Data, about 12 percent of Arizona middle grade students took Algebra I. Though Arizona outpaces Georgia, West Virginia, Tennessee and a few other states, our state has some ways to go to reach the national average of 17 percent of seventh and eighth grade students enrolled in an Algebra I class.

I know, I know…it would be better to just report eighth grade data, but the collection instrument grouped seventh and eighth grade students together and there’s no way to separate out the results by grade. The map (left) shows how Arizona compares relative to other states in the proportion of seventh and eighth grade students enrolled in Algebra I. Click on the map to see details for all states and for every middle school in the country.

California, Virginia and Minnesota lead the country in middle school Algebra I enrollment, with Minnesota markedly ahead of the rest of the country (spurred by MN’s graduation requirements no doubt).

STATE RANKS: PERCENTAGE OF GRADE 7 AND 8 STUDENTS ENROLLED IN ALGEBRA I (2014)

The reality is that in Arizona, like many other states, students begin to accelerate in math in fifth through eighth grade, taking high school courses and assessments. According to AzMERIT data (Arizona’s statewide assessment) about 19 percent of eighth grade students took a higher level end-of-course math exam in 2016—the majority of these students taking the Algebra I exam. Most of you, skeptical readers, do not know this fact because data on eighth grade end-of-course testers is not reported anywhere publicly. These results will be published soon in an upcoming blog, so stay tuned.

To date, Arizona has only focused on AzMERIT scores in eighth grade that exclude advanced middle school math students taking Algebra I and II and Geometry classes. The lack of transparent data on math acceleration creates big hurdles for policy makers who aim to advance policies that will drive academic excellence in math. Arizona could choose (or not) to set Algebra I as the goal for eighth graders like Minnesota. Or we could choose (or not) to follow Governor Ducey’s strategic goal for all students to be “proficient in algebra skills by the end of grade 8.”  Regardless where you land, an informed debate would benefit from a public reporting of number of accelerated math students in fifth through eighth grade along with their performance.

As always, if you want to carp about my use of aphorisms or discuss the proper way to analyze and interpret Civil Rights Data Collection files, drop me a line at kelly@azcharters.org.

Categories
Education Blog

ALTERNATIVE SCHOOLS: JUST THE FACTS

As the debate over a new accountability system for Arizona rages on, alternative schools across the state are facing the unknown for how their educational philosophies and outcomes will be measured in the years to come. Alternative school accountability methods are anticipated in August 2017, but who are these alternative schools, and whom are they serving? This month, the Association examines these Arizona schools that often go overlooked, and their role in the state education system moving forward.

Our research shows two notable facts:  (1) from 2012 to 2015, alternative schools – both district and charter – have seen rising four- and five- year  graduation rates, and (2) the number of alternative schools and number of students enrolled in alternative schools have declined since 2012 by 18% and 16%, respectively.

WHO ATTENDS ALTERNATIVE SCHOOLS?

Alternative schools are defined as schools that serve specific populations of at-risk students. “At risk” is defined in statute as a student who meets any one of six categories- documented disruptive behavior, dropout,  struggling academically, adjudicated, primary care giver or ward of the state.  In addition, it is estimated that alternative schools – which are predominantly charters – serve a higher percentage of racial minorities, English language learners, free and reduced lunch populations, and special education students than the state average.

Although 43 states and the District of Columbia have formal definitions of “alternative education,” there are significant variations across state borders. Some states’ alternative schools offer regular instruction, social skills support, career education, or behavioral services, while others’ do not. In general, though, alternative education programs are developed to serve students who are unable to benefit from “traditional” school programs; this can include those with behavioral problems, those who have dropped out, or those with chronically poor attendance.

Arizona has its own set of rules as to who an alternative school is meant to serve, which includes students who are more than one year behind in academic credits, adjudicated students, or students who have dependents. A full definition of Arizona alternative schools and school populations can be found here. Arizona schools must request Alternative School Status through the department of education, and adhere to guidelines set forth by the state.

In line with the very mission of alternative schools, it follows that compared to statewide averages, a higher percentage of at-risk students are being served by alternative schools.

At-Risk Populations in Alternative Schools

In addition, the Association estimates that alternative schools are serving a higher percentage of black and Latino students than the state average, but a lower proportion of white students than the state average. Due to the often-small populations within alternative schools, much of the data regarding race and ethnicity was redacted from pubically-available files. The below table represents an estimate of alternative school composition, based on available data.

Estimated Ethnicities for Alternative Schools, Compared to Arizona State Averages

TRENDS IN ALTERNATIVE SCHOOLS

In the past five years, the number of alternative schools in Arizona has been declining, along with enrollment. Interestingly, the number of charter alternative schools has stayed relatively stable during the time period, while a reduction in the number of district alternative schools has fueled the waning trend within the sector. This phenomena may be partially explained by the Arizona Department of Education’s alternative school application process which began in 2014 and required both a formal application, verification and auditing of student data.  It is unclear whether the decline is a function of rejected or reduced applications to the state.

The enrollment data for alternative schools looks similar to the above graph; there were close to 30,000 alternative students in FY12, but that number has since fallen to 23,170 in FY16.

It should be noted that from 2012 to 2015, alternative schools – both district and charter – have seen rising four- and five- year  graduation rates. The department of education reports graduation rates over the span of four to seven years for each cohort of potential graduates that enter high school within a given year. That is, students can be reported as graduates in four years (most typical), five, six, or even seven years. The difference between four-year to seven-year graduation rates is an especially critical difference for alternative schools, who often work with former dropout students or students with dependents. For the purposes of this blog, the Association examined four- and five-year graduation rates within alternative schools[1] over the past four cohorts of incoming high schoolers. We found that for the 2015 cohort, an average alternative school graduated 38% of its eligible students in four years. Given that same cohort, though, alternative schools, on average, had graduated 49% of their students over the course of five years. The below graph shows how average graduation rates in alternative schools have increased over time for all alternative schools:

WHAT IS NEXT FOR ALTERNATIVE SCHOOLS?

The A-F letter grade accountability system for public schools, including alternative schools, was put on hold after the 2014 results.  Alternative schools are subject to different performance criteria than traditional schools; their accountability labels also differentiate them as alternative schools, i.e.,  “A-ALT” or “B-ALT”.  The 2017 A-F accountability systems will continue evaluating traditional and alternative schools separately.  Given the relative number of alternative schools it’s not surprising that little time has been spent on the development of the alternative school framework.

In terms of alternative schools in the larger educational landscape, it’s interesting to see the potential impact that an accountability policy decision (application and enrollment audits) had on both quantity and quality of a particular school type.  These data suggest that a corresponding reduction in the number of alternative schools positively impacted the overall quality as measured by increased graduation rates.  Is it this simple? Could a straightforward application and student enrollment audit weed out poor performing schools? Certainly, these data can’t confirm this hypothesis but it does beg the question.


Footnotes and References

[1] Data on six- and seven-year graduation rates is currently not posted on ADE’s website. The Association reached out to the department of education for the data, and as of this blog’s press time, the data had not been obtained.


Categories
Education Blog

ARIZONA RANKS 49TH IN EDUCATION FUNDING – HOW DID WE GET HERE?

While acknowledging Arizona K-12 funding is low compared to the national average, Governor Ducey in his state of the state provided policymakers 15 points to make Arizona more competitive for our educators and students.

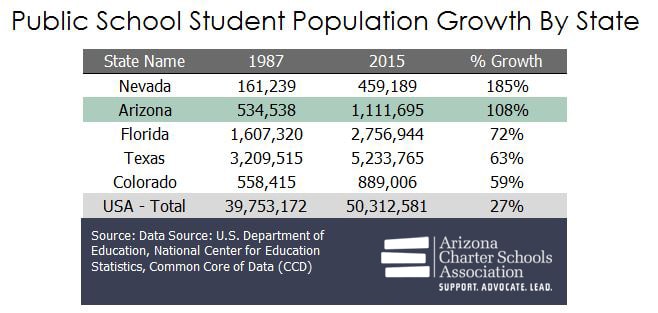
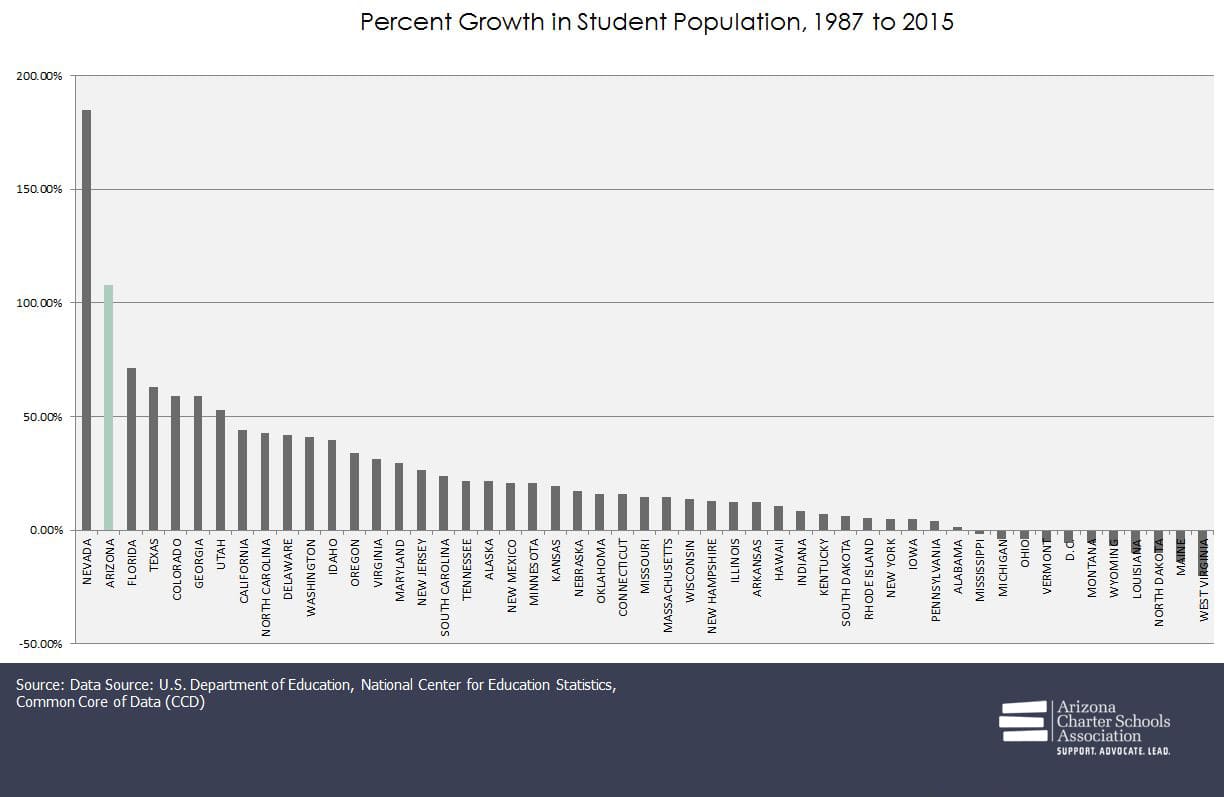
But how low is our per-pupil funding compared to other states? And how long have we ranked near the bottom of the nation?  In this month’s blog, the Association compiled historical school funding metrics to evaluate how Arizona stacks up against other states in terms of funding per pupil, pupil-teacher ratios, and school size. In terms of school funding – we won’t mention hair styles – the ‘80s were great. Arizona funded its schools at levels slightly above the national average. Unfortunately, Arizona now is skimming the bottom of the funding barrel. Arizona boasts some of the largest teacher-student ratios while its school sizes near the national average.

Funding Per Pupil

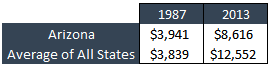
The National Center for Education Statistics reports that in the late 1980s, Arizona funded its public schools at the national state average in terms of per-pupil revenues. But in the 1990s through the 2000s and up until the most recent data available (2013), Arizona slipped to “bad” and then to “worse”, becoming one of the lowest funded public education systems in the country, on a per-pupil basis.

The last complete revamping of Arizona’s school finance system occurred in 1980. At that time, policymakers sought to limit local tax liabilities while “equalizing” funds between school districts to ensure a degree of equity. Besides annual skirmishes regarding school funding at the Legislature, Arizona has litigated the funding formula over inflation, capital improvements and maintenance, and funding our English language learners.

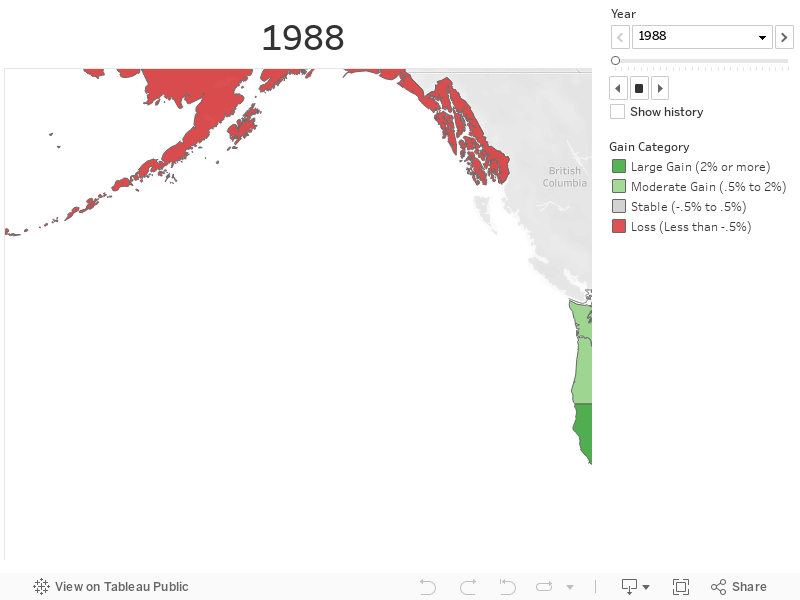
In 1994, Arizona lawmakers established a system of charter schools, separate from school districts and with a completely different school funding system. The narrated video below provides a national look at how states fund students, on a per pupil basis. On the left, a bar graph illustrates the state-by-state differences in funding in absolute dollars. On the right, the same information is displayed, but in map form. Click play to see how funding changes for each state over time, from 1987 to 2013.

For an interactive dashboard of the state-by-state funding per pupil video, click here. The dashboard allows for a more detailed look at each state or each year of the video.

In the final year of the above video (2013), the inter-mountain West (Arizona, Utah and Idaho) settled in as the lowest public school funding in terms of per-pupil dollars. Though Arizonans passed a number of funding initiatives (Proposition 301 in 2000, Proposition 123 in 2016 and scores of local district bonds and budget overrides), the per pupil downward slide continued.

Pupil-Teacher Ratios

Teachers and teaching staff are the largest expenditure in Arizona’s school system.  Not surprisingly, Arizona and other states in the bottom quarter of per-pupil revenue distribution tend to have larger class sizes.

In the narrated animation below, state per-pupil funding is plotted against student-teacher ratios for all states, and tracked over time. From these data, it is unclear how the rumored impending teacher shortage crisis plays out as a cause or a symptom of relatively large class sizes and low revenues. As of 2013, the western states of Utah, Arizona, Nevada, California, Washington, and Oregon had established themselves as a cohort of states having the highest pupil-to-teacher ratios, and some of the lowest per-pupil funding.


Average School Size

Arizona has been above average in the number of students per school site over the years.  Though the national average school size has shrunk, Arizona is still above the national average. Given the state’s funding mechanism, historical interests for smaller learning communities and Arizona’s robust school choice movement, it is not surprising that extremely large schools, with relatively low per-pupil administrative costs, have not manifested. In fact, Arizona’s school sizes were larger before Arizona allowed charter schools in 1994. As charters grew in number, Arizona average school sizes have shrunk incrementally, nearing the national average.

Despite this trend, in 2015, Arizona lawmakers voted to eliminate “small school weights” for charter schools that are part of a network , even if the schools are located far apart. Arizona is scheduled to completely eliminate small school weight funding for charter schools during this legislative session.

For an interactive dashboard of the average school size video, click here. The dashboard allows for a more detailed look at each state or each year of the video.

Conclusion

Arizona wasn’t always competing for last place in terms of school funding.  As recently as the 1980s, Arizona spent at the national average per pupil.  In less than thirty years, Arizona’s relative ranking has dropped by double-digits, despite more than doubling the state’s per pupil allocation to schools. Failure to keep up with the national trends in school funding has serious consequences for Arizona’s education system. First, Arizona has some of the highest student-teacher ratios compared to other neighboring states. Second, Arizona’s school sizes are shrinking closer to the national average. This meeting in the middle means that, on average, Arizona’s schools are cramming more students into classrooms to maximize the resources that the schools receive.  It is unclear how long Arizona’s education system can keep this up.

Categories
Education Blog

EVER SINCE FLORES: A REGIONAL PERSPECTIVE ON ENGLISH LANGUAGE LEARNERS

Arizona’s students identified as English Language Learners are declining on crucial achievement measures since 2000, and are faring worse than their counterparts in neighboring border states of California, New Mexico and Texas.

This blog is Part Two of our series that explored significant events and trends in the education of Arizona’s English Language Learners since the Flores Consent Decree of 20001. In Part One, we diagrammed recent Arizona-specific achievement measures, as well as a timeline of important English Language Learner events.

Categories
Education Blog

EVER SINCE FLORES: THE HISTORY OF ENGLISH LANGUAGE LEARNERS IN ARIZONA

A TWO-PART LOOK AT THE DATA BEHIND ENGLISH LANGUAGE LEARNERS IN ARIZONA

Eleven years ago, nearly 20 percent of Arizona’s public students were not proficient in English – meaning their primary language was non-English. Today, between 4-7 percent of our students are classified as not proficient in English. These statistics seem puzzling, given Arizona is a border state, has an increasing K-12 population and is commonly thought of as growing in diversity. Either the data is askew or our rapidly rising K-12 population has a lot more English speakers than it once did.