Categories
Education Blog

EXCELLENCE IN THE PHOENIX URBAN CORE

By Eileen Sigmund and Lisa Graham Keegan

Newly released AzMERIT data show a spectacular picture of what excellence — and emerging excellence — looks like.

Take the Phoenix urban core as an example. There are 219 schools serving nearly 130,000 students. When looking at the top 20 public schools that performed the best in math, we see two REALLY important things: half are district schools and half are charter schools. And most importantly – please set down your coffee and focus – HALF of the schools serve a majority of low-income students, and half serve a higher wealth population.

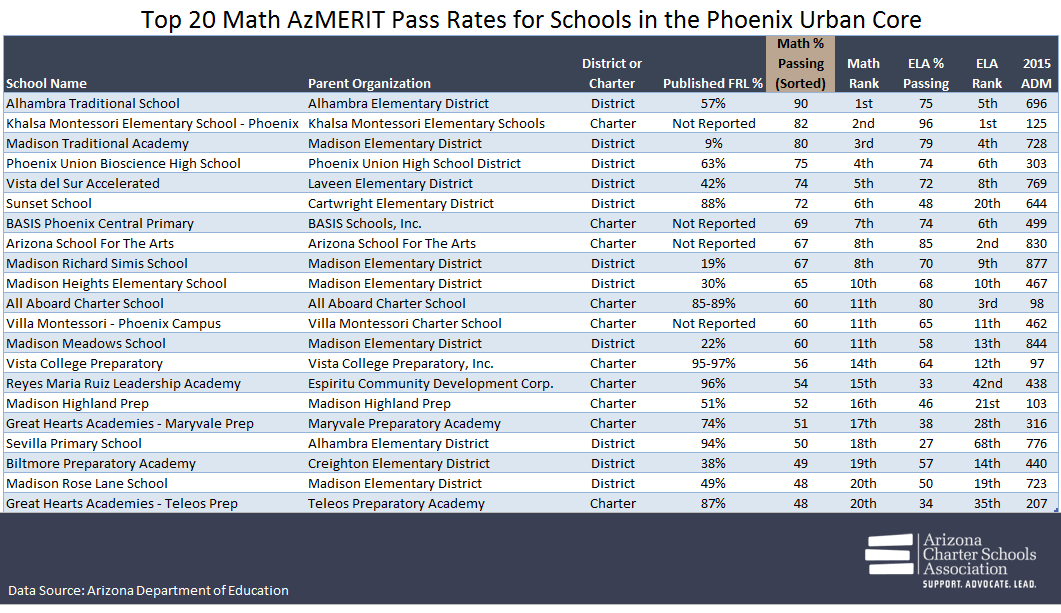
What this says to us is that excellent school performance is first and foremost a function of the people inside a school who make a decision about what they expect from themselves and their students every day.

Both district and charter schools are offering this level of “great”, and schools serving low-income students are often outperforming much higher wealth schools. The job for parents is to know who is offering quality and to access that for their children. The job for the rest of us is to play whatever role we have in order to get the schools under our influence or in our communities up to these same higher quality levels.

Nothing about this chart of achievement says that we are done – there is plenty of room to grow, and the schools on this list will be the first to say so. But let’s at least focus on some amazing progress and potential. Please let’s not thwart the progress we are making in Arizona schools by pretending that school type or wealth of students alone is what makes a great school.

A great school is a group of people whose commitment is extraordinary and whose skills are enormous.

We send our greatest thanks to all of them.

ABOUT THE AUTHORS

Eileen is the former President and CEO of the Arizona Charter Schools Association. The Association is a non-profit membership and advocacy organization, providing academic, operations and school development support for Arizona’s charter schools. Eileen has a strong advocacy background, having served as a journalist, litigator, and lobbyist. Eileen is a 2013 Pahara-Aspen Education Fellow, an Arizona Chamber Commerce & Industry Board of Directors member, and she sits on the Charter Schools Development Corporation Advisory Council.

Lisa is the founder and Executive Director of A for Arizona, and is honored to serve as Senior Advisor to National School Choice Week, an annual public awareness campaign to advance excellent choices in education. She has spent 14 years as Principal Partner at the Keegan Company, which focuses on emerging excellence in American education. Mrs. Keegan spent a decade from 1991 – 2001 serving as Arizona state representative and then elected state school superintendent. Lisa has received the Milton and Rose D. Friedman Foundation Award for Leadership in Educational Choice, the Arizona Chamber of Commerce 2013 Milton Freidman Award for visionary leadership in Arizona, and was inducted into the Hall of Fame by the National Alliance of Public Charter Schools in 2013. She served as education advisor to John McCain’s campaigns for president, and was interviewed in 2000 by President-Elect Bush for the job of US Secretary of Education. She also serves on many national and local boards committed to providing an excellent education to more students, including the Arizona Charter Schools Association, Teach For America – Phoenix, Corps Knowledge, and America Succeeds.

Categories
Association Blog

Arizona Voters Believe State Spends ‘Too Little’ on Education, Poll Says

Most voters believe Arizona is spending “too little” on K-12 public education, according to a recent poll by the Arizona Republic/Morrison/Cronkite News.

According to the poll, 74 percent of voters believe the state is spending “too little” on education. This news reaffirms that education is still a priority of voters. Another poll from the Morrison Institute of Public Policy and Arizona State University’s Walter Cronkite School of Journalism and Mass Communication in 2015 showed similar results, with 74 of voters saying the state was spending too little on education, according to the Republic.

Categories
Association Blog Press Releases

Charter Students Again Lead the State in AzMERIT Scores

For the second straight year, Arizona charter students outperformed their peers across the state. According to AzMERIT scores released this week, charter students scored better than the state average in the ELA and Math assessment in every grade level and subject area except Algebra I, where charter students tied the state average.

The AzMERIT scores, released by the Arizona Department of Education on September 15, show the hard work and dedication of Arizona’s charter students, teachers and leaders.

“I’m proud to see Arizona’s charter school students continuing to set a strong example of educational excellence. For the second straight year, charter students outperformed the state average in virtually every grade level and subject,” said Eileen Sigmund, President and CEO of the Arizona Charter Schools Association. “While more work remains, these scores are strong validation of the hard work and dedication of our students, teachers and leaders. We’re moving in the right direction, and we’re getting results.”

AzMERIT Charter Highlights

  • Public charter students outperformed the state average of students passing the English/Language test on average by 9 percentage points.
  • Public charter students outperformed the state average of students passing the Mathematics test on average by 6 percentage points.
  • All 50 of the top LEAs on the English/Language Arts exam are charter schools, when looking at percent of students passing the test.
  • 49 of the 50 top LEAs on the Math exams are charters, when looking at percent of students passing the test.

NAEP “The Nation’s Report Card”

Arizona’s charter students outperformed nearly every other state on the 2015 National Assessment of Educational Progress. On eighth grade mathematics, for instance, Arizona charter students scored in a statistical dead heat with Massachusetts, the highest scoring of the 50 states.

NAEP Infographic
Download our fact sheet here. You can view our 2015 results here.
Categories
Education Blog

NET GAINS – CHARTER GROWTH WITHIN SCHOOL DISTRICT BOUNDARIES, PART I

Where has Arizona’s charter school movement grown in the last decade? We found that Tucson Unified School District saw the most new charter schools within its borders, gaining 19while Queen Creek Unified School District gained the most charter students, increasing by 5,286[1].

In Part 1 of our series, we analyzed the net gain of charter schools and students within school district boundaries from FY06 to FY15. In a previous blog we examined overall state attendance trends at the county level.

CHARTER SCHOOL GROWTH WITHIN DISTRICT BOUNDARIES

Figure 1 shows school districts that have had the greatest net gain of charter schools within their geographic boundaries from 2006 to 2015[2]. “Net gain” in charter schools is just that – the difference in number of charter schools within a district’s boundaries in 2006 and 2015. It is possible that any number of schools could have actually opened or closed in the years between these two snapshots in time, but in this blog we focus on the net change in the number of schools within a district attendance area.

FIGURE 1: GEOGRAPHIC SCHOOL DISTRICTS WITH LARGEST NET GAIN IN CHARTER SCHOOLS, FY06 TO FY15

Most of the net growth of charter schools has been focused in school districts surrounding Phoenix and Tucson, with Tucson Unified leading the state. Large districts in the northern and southwestern parts of the state have also seen modest net gains in charter schools within their boundaries, namely Yuma Elementary District (2), Flagstaff Unified District (2), Camp Verde Unified District (2), Humboldt Unified District (3) and Prescott Unified District (3).

Perhaps more intuitive and interesting than the table in Figure 1, though, is a look at how the net gain numbers have actually played out throughout the landscape of the state. Taking a closer look at the Phoenix area, we can examine which Valley communities have seen the greatest gains in charter schools. Mesa Unified leads the way in the Valley, gaining 12 charters from 2006 to 2015, while Queen Creek and Roosevelt had a net gain of 10 each.

The interactive map below shows charter school net gain by school district. School districts with a net change of 0 have been excluded. Click on the markers to see the district’s net gain in charter schools.

MAP 1: NET GAIN IN CHARTER SCHOOLS BY SCHOOL DISTRICT, FY06 TO FY15

CHARTER STUDENT GROWTH WITHIN DISTRICT BOUNDARIES

In a related but slightly different question, the Association also looked at absolute net change in charter school attendance, rather than number of charter schools. Figure 2 shows the top ten school districts for net charter average daily membership (ADM) gain between 2006 and 2015:

FIGURE 2: GEOGRAPHIC SCHOOL DISTRICTS WITH LARGEST NET GAIN IN CHARTER SCHOOL ADM, FY06 TO FY15

Tucson Unified is still near the top of the list, however, cedes its number one spot to Queen Creek Unified when the question is viewed through the lens of total students rather than schools. Notably, the two districts that appear in Figure 2 that do not appear in Figure 1 are Coolidge Unified District and Deer Valley Unified District. This suggests that these two districts either added a small number of larger charter schools within their boundaries, or saw strong growth rates within the existing charter schools from 2006.

Again, to see how total charter attendance has changed the educational landscape of the state, the Association mapped the net gain or loss of charter students within all school districts. The picture was similar to that of charter school net gain. Click on the markers to see the district’s net gain or less of charter students.

MAP 2: NET GAIN OR LOSS IN CHARTER STUDENTS BY SCHOOL DISTRICT, FY06 TO FY15

Focusing on the Phoenix area’s overall net change in charter student enrollment, we see similar patterns that reflect the number of charter schools gained within each district’s geographic boundaries. Queen Creek Unified, Higley Unified and Chandler Unified are represented by blue dots on the southeast side of the Valley, while districts like Deer Valley Unified and Peoria Unified can be seen on the northwest end.

SCHOOL IMPLICATIONS

Just as the past decade of overall K-12 growth in Arizona paints a misleading picture of certain counties with declining enrollment trends, the growth of charter schools and students over the past decade should be understood at a finer level than simply the evaluation of statewide trends. As our state grows in population, the growth of our public schools should meet the needs of families. Policy makers should consider enrollment trends, geography, demographics, and community needs in making K-12 policy decisions.

In our next blog, the Association will take a closer look at the charter landscape within districts. In it we will evaluate charter student market share within traditional school district attendance boundaries. This analysis will highlight those districts that are saturated based on the number of schools as well as the number of charter students and how these districts have changed over time.

FOOTNOTES/REFERENCES

[1] This blog is part one of a larger series which will focus on Average Daily Membership trends and snapshots as they relate to the geographic boundaries of a school district. This blog will primarily focus on total gains (“absolute” terms), rather than consider the increases in terms of a percentage of existing ADM or existing number of schools (“relative” terms).

[2] Schools that do not serve students in a typical fashion in a geographical location have been excluded.  In the case of district schools, the Association used state ADM data gathered at the school and district level. In the case of charter schools, the Association gathered geographical information for all charter schools that are currently open, and assigned them to a geographical school district. For certain types of schools that do not have a geographical location listed with ADE, or whose ADM trends are outside the scope of this blog, data were excluded (such as select online schools, JTEDs, accommodation/transportation schools and select BIA schools). Also, there were 11 total charter schools that existed in FY06 but not in FY15, and these were excluded from the geographical analysis.

Additional Note: The Association also created printer-friendly maps that give an overview of which school districts in the state have seen the most charter school growth within their boundaries. Download our PDF of charter growth in school districts HERE.

Categories
Association Blog

The Real Story on Public School Funding

How much money do public schools receive to educate students?

In the last two decades, a significant, although narrowing funding gap has persisted between school district and charter schools.

Categories
Association Blog Charters Changing Lives

Mexicayotl’s Story

How one Nogales charter school helped students see their own value.

About 20 years ago, Baltazar “Balty” and Veronika Garcia realized something was amiss in the Nogales community where they both taught high school students.

Many of their students brimmed with potential, but seemed to lack a sense of identity and enough support to push them towards greater possibilities.

The Garcias wanted to change the trajectory of these students’ lives, and knew it had to start in kindergarten.

Arizona’s budding charter school law was in its infancy when the Garcias decided to help improve the outcomes for students on the border, opening Mexicayotl Academy of Excellence in 1998.

Categories
Association Blog Press Releases

And the Survey Says…Education a Top Priority for Legislative Candidates

Nearly 9 in 10 candidates running for the Arizona Legislature – 87 percent – say they rank K-12 education as their first or second priority. That’s according to legislative candidates who responded to a new survey distributed by the Arizona Charter Schools Association.

The Association, a non-profit advocacy organization for public charter schools, asked all Arizona legislative candidates to participate in a survey that sought their perspectives on public education.

The survey posed a dozen questions to candidates on a variety of topics related to public schools, both charter and district. You can find a complete list of questions and survey results here.

Categories
Education Blog

THE CONUNDRUM OF MEASURING SCHOOL QUALITY: RAISE ACHIEVEMENT OR CLOSE THE GAP?

Results of the 2015 AzMERIT testing data show that students in charter schools consistently outperform students in district schools, across all racial and ethnic groups. But does the higher student achievement lead to a closing of the achievement gap between different groups of students? The Association’s analysis shows that the differences in achievement of student subgroups within charter schools actually serves to widen the already large achievement gap.

CHARTER AND DISTRICT DEMOGRAPHICS[1]

Figure 1 shows the racial and ethnic composition of all Arizona public schools during the 2014-2015 school year.  Latino students comprise the largest group (44 percent) in the state, followed by White students (40 percent). The next largest group, African American students, is only slightly above five percent of the state, followed by Native American enrollment at slightly below five percent, with all other groups reporting fewer than five percent each.

FIGURE 1: DISTRIBUTION BY ETHNICITY IN ARIZONA PUBLIC SCHOOLS FY2015

Figure 2 illustrates notable differences in the composition of district and charter school students. Charter schools serve a larger share of White students, 47 percent compared to 39 percent in district schools. Charters also serve a larger share of Asian and African American students than district schools. Conversely, charters serve a smaller share of Latino students, 36 percent compared to 46 percent in district schools, and a significantly smaller share of Native American students.

FIGURE 2: DISTRIBUTION BY ETHNICITY IN DISTRICT AND CHARTER SCHOOLS

These data suggest that White, Asian, and to a smaller extent, African American families are more likely to choose charter schools than other students and families.  When evaluating these students’ overall academic performance, this decision appears to pay off.

AzMERIT RESULTS – THE CHARTER ADVANTAGE

The figure below (Figure 3) shows the percent of students passing the AzMERIT exam in 2015, broken out by school type (district or charter) and student subgroup. These data combine the passing rates across grade levels in English Language Arts (ELA) and Math.  In both content areas, charter students in all subgroups have higher passing rates than their district counterparts.  These data demonstrate that charter schools are providing increased academic outcomes for the students enrolled – at least for the 2014-15 school year. For Arizona charter schools this is good news, given that a charter, by definition, is a contract to improve student achievement.

FIGURE 3: DISTRICT VS. CHARTER PASS RATES BY ETHNICITY ON 2015 AzMERIT

The charter advantage—the difference between charter and district performance—is particularly large for Asian students, a relatively small group of students in both sectors.  Charter schools enroll a significantly higher percentage of Asian students than district schools and provide a 20 point pass rate advantage over district schools in both ELA and Math. The charter advantage for White students is also significant, nine points in ELA and five points in Math.  We see a similar charter advantage for students from two or more races and Native Hawaiian/Pacific Island students.  These four groups of students account for over 55 percent of charter enrollment; they are all scoring above the state average in ELA and Math and their results help explain charter schools’ overall performance.

Latino, African American, and Native American students also see a charter advantage, but a somewhat smaller one. Despite the gains experienced in charter schools, none of these groups perform at or above the state averages in ELA or Math.

AzMERIT RESULTS – THE ACHIEVEMENT GAP

The initial results indicate there is an achievement gap between districts and charters – where overall charter students are outperforming their district peers.  The Association also wanted to investigate achievement gaps between subgroups of students within charters and districts.  The table below shows achievement gaps within charters and districts for each of the major subgroups of students, in both ELA and Math.

For example, the ELA Asian/White achievement gap (the difference between the passing rates for these two subgroups in ELA) in charter schools is 20 percentage points compared to 9 percentage points in district schools.  This means that the passing rate for Asian students in charter schools is 20 percentage points higher than their White charter peers, whereas Asian students in district schools outperform their White district peers by only nine percentage points.

FIGURE 4: ACHIEVEMENT GAP BY RACE/ETHNICITY AND SCHOOL TYPE

The most striking finding in this analysis is the relative size of the achievement gaps between subgroups, regardless of school type. With only two exceptions, all gaps are at least 20 percentage points.  Of all groups, Native American students have the lowest performance in both ELA and Math, and have the widest achievement gaps compared to their peers. The Asian/Native American gap shows the size of the extremes.

White and Latino students represent the two largest groups in the state and their achievement gap is illustrated in the figure below. Since the charter advantage for White students is greater than it is for Latino students (see Figure 3), the size of the achievement gap is greater in charter schools than in district schools.

FIGURE 5: WHITE/LATINO ACHIEVEMENT GAP BY SCHOOL TYPE


IMPLICATIONS

Policy makers are beginning to contemplate school accountability measures to evaluate the quality of Arizona’s public schools.  The new A-F formula will include a combination of proficiency and growth measures.  These data suggest that charter schools are likely to fare well in the overall evaluation when proficiency rates are compared to their district counterparts.  The new A-F system must also integrate federal requirements to evaluate subgroup performance on AzMERIT and other indicators of school quality. The evaluation of achievement gaps in subgroups is a critical component in the identification of schools for targeted and comprehensive support (federal intervention).  These data suggest that charter schools are likely to fare worse in the evaluation of achievement gaps, despite their overall higher performance.

In addition to accountability implications, these data raise questions about overall academic performance of student subgroups and ways that schools can close achievement gaps that exist among them.  Clearly, the answer is not to reduce the rate at which Asian and White students are performing in schools.  Rather, there needs to be a focus on replicating that same, or greater, performance for other student groups across all public schools.

FOOTNOTES/REFERENCES

[1] The Association used 2015 AzMERIT data for all public schools to evaluate their performance.  The AzMERIT data provided were unredacted, through a research agreement with the Arizona Department of Education; these data included details for small schools and student groups that are not available in the publicly released data file.  The demographic data included in these analyses were obtained from the October 1 Enrollment file for 2014-2015 (unredacted).

Categories
Education Blog

WILL THE PUBLIC HAVE A SAY IN ARIZONA SCHOOLS’ NEXT ACCOUNTABILITY SYSTEM?

Rating Arizona’s 2,015 public schools with a label of A-F helps the community identify the quality of the school.  Letter grades were assigned from 2012-2014 and suspended in 2015 and 2016 as Arizona students transitioned to a new statewide test.  Letter grades are based, in part, on how students perform on Arizona’s statewide test.

To grade schools in 2017, the Arizona Department of Education asked the community to participate in a Request For Information on the new A-F system’s components and methodology. However, in order to respond to 45 questions, the public must have extensive technical knowledge.  Thus while the Department of Education is attempting to solicit feedback from the public, the unintended consequence is likely to be greater exclusion of all stakeholders.

Further, anyone submitting a response to the 45 questions in the Request For Information is excluded from participating as a technical or policy advisor during A-F methodology discussions.

Public Engagement

In 2014, the State Board of Education developed the A-F School Accountability Principles of Agreement[1] in preparation for the development of the new A-F formula.  These Principles were created collaboratively with stakeholders and advocates to ensure the newly developed system aligned with the Board’s philosophical, technical and implementation expectations.  In part, the Principles state:

“A coalition of technical and policy stakeholders must be consulted to create, evaluate and refine the methodologies used in the achievement profile to ensure transparency, feedback from the field and community, and compliance with Agreements.”

Additionally, the Every Student Succeeds Act (ESSA)[2] requires meaningful stakeholder participation in the development of the state’s accountability system.  In the past, the Arizona Department of Education utilized technical advisors to support the development of accountability concepts, indicators and methodologies; they focused outreach efforts to school personnel through presentations and targeted communication strategies, and the general public had access to materials once they were available for presentations to the State Board of Education.  In response to these newly stated expectations for increased public engagement the Department released a Request For Information (RFI) for Arizona School Accountability Components and System[3] to solicit stakeholder opinions and feedback.  On the face of it, this new RFI process should yield more opportunities for broad stakeholder engagement in the development of the A-F accountability system.

Unintended Consequences

However, the purpose statement of the RFI strays from this goal.  It states “this RFI solicits feedback from interested parties with any relevant expertise, systems or methodology they have developed or conceptualized which meet the intent of any of the components described below” (page 2). This language, “relevant expertise”, is likely to alienate the general public and exclude them from the process altogether. If the purpose statement doesn’t scare the public from responding, the introduction might.  It makes it clear to the reader that responses should be framed within the new ESSA requirements, A.R.S. § 15-241, SB 1430, State Board’s Principles of Agreement, Superintendent Douglas’ plan as well as other historical documentation.  While the RFI states that respondents are invited to respond to one, any or all of the 45 questions contained – the sheer magnitude of the document is likely to limit responses.

So then, it would seem that the RFI is really designed to solicit responses from the State Board’s coalition of technical and policy advisors. The technical advisory group is made up of individuals who represent a variety of education stakeholders; large and small districts, charter schools, online schools, alternative schools, etc. The policy advisors include the business and philanthropic communities as well as advocacy organizations. These groups represent individuals who have relevant expertise, have likely developed or conceptualized systems or methodologies, and have knowledge of the pertinent statutes and requirements described. Many of the Board’s advisors have also historically provided technical assistance to the Department in the development of prior accountability systems.

The RFI makes it clear that any and all developed or conceptualized systems and methodologies or any suggestions previously submitted for consideration must be resubmitted through the RFI for consideration. This requirement applies to both the general public and to any technical or policy advisor of the Board or Department.  The RFI goes on to state, “respondents to this RFI will be excluded in evaluating and integrating responses which may or may not result in a high stakes accountability system and related competitions” (page 3).  This exclusionary language creates a catch-22 and puts all of the State Board’s technical and policy advisors in an untenable position.  That is to say, if any technical and/or policy advisor submits a response to suggest ways to create or refine the methodologies used in the achievement profiles they won’t be unable to participate in future accountability discussions and methodology decisions.

The Impact

Since 2014, Arizona schools and education advocates have been anxiously awaiting new letter grades.  Due to a two-year moratorium negotiated between education advocates and the legislature, schools have been left holding on to legacy letter grades. This is great news for the 67% of schools that earned an A or B but not ideal for the remaining schools. As the 2016-17 school year approaches, the first year of the new accountability system’s implementation, little is known about how schools will be evaluated.

The issuance of the Department’s RFI puts the development of the state’s new accountability system in jeopardy. First, the RFI will likely limit new and innovative methodologies and concepts created by Arizona’s most qualified technical and policy experts because they are unlikely to submit responses. The resulting accountability system may look very similar to prior system; despite the opportunities for innovation provided by the revised state and federal statutes. Second, it restricts the State Board’s technical and policy advisors from carrying their explicit role to “create, evaluate and refine the methodologies used in the achievement profile” as outlined in the Board’s Implementation Principle.  Each of these outcomes has the potential to undermine the newly developed system and introduce unnecessary distrust and skepticism.


References and Footnotes

[1] Arizona State Board of Education’s A-F Accountability Principles of Agreement, implementation agreements  https://azsbe.az.gov/resources/f-school-letter-grade-accountability

[2] Every Student Succeeds Act (ESSA) Dear Colleague Letter regarding collaboration http://www2.ed.gov/policy/elsec/guid/secletter/160622.html

[3] Arizona Department of Education’s Request for Information (RFI) for Arizona School Accountability Components and System http://www.azed.gov/accountability/rfi/

Categories
Charters Changing Lives

Bringing Light to a Community

Roberto Castillo understands the dangers that can lurk behind dark corners, alleys and other hidden spots in his neighborhood.

About three years ago, Castillo, who lives in Maryvale, and his cousin were robbed as they were walking home after playing soccer.

“As we were walking home, these two guys were behind us. We didn’t notice because it was kind of dark,” he said. “In no time at all, they just dropped us to the ground and grabbed anything they could.”

That experience motivated him to search for ways to improve safety in his neighborhood and eventually collaborate with two like-minded students in his social entrepreneurship class at Western School of Science and Technology: A Challenge Foundation Academy, a public charter school in Maryvale. Western opened in 2014 as one of the inaugural schools in the New Schools for Phoenix program, which aims to increase the number of high quality schools in Phoenix’s urban core. The school serves grades 7-10 and will grow to serve seniors by 2018.