Categories
Press Releases

Charter Association Board of Directors Confirms New Member

Beatriz Rendón Welcomed as Newest Member to Arizona Charter Schools Association Board

The Arizona Charter Schools Association is pleased to announce a new member to its Board of Directors, Beatriz Rendón, Senior Associate Vice President of Educational Outreach and Student Services at Arizona State University. See an article in the Phoenix Business Journal here.

Rendón is responsible for building and diversifying the pipeline of college going students into ASU, which includes her position as the Chief Executive Officer of ASU Preparatory Academy. The K-12 public charter school currently serves over 2,000 students in grades PreK-12.

As an education expert on the Association’s Board of Directors, Rendón will advise Arizona’s largest charter support organization in its mission to support student achievement though high-quality charter schools, advocate for student equity and charter school autonomy, and lead Arizona charter schools as a sustainable, strong and credible organization.

Categories
Education Blog

A Look at Arizona’s Public Schools’ Tax Credits, Part II

Continuing our look at Arizona’s public school tax credits, Table 2 shows the statewide trend in the number of contributions and the average contribution amount. A contribution may be a single person or a couple, so the number of contributions does not precisely reflect the number of taxpayers who are using the tax credit, but it does provide a useful indicator of the change in the level of taxpayer participation. To put this number in perspective, in 2012, Arizona residents filed over 2.7 million state income tax returns [1], suggesting fewer than ten percent of filers are using public school tax credits.

Table 2: Number and Average Contributions, 2005-2013

The number of contributions increased a total of 18% from 2005 to 2013. This rate is less than half of the 44% increase in the total contributions received by public schools in these years. This can be explained by the fact that the average contribution amount increased 22% during the same period of time, although it did fluctuate somewhat during these years. In other words, more people are contributing larger amounts of money.

It should be noted that the taxpayer may take the tax credit for a donation to a public school or for the payment of fees associated with a student’s extra-curricular activities. For example, a parent may make a $200 contribution to support a school’s athletic programs and take a $200 tax credit, or she can pay $200 in fees associated with her child’s participation in the school’s basketball team and take the same $200 tax credit (or a combination, within the allowable limits).  Available data do not allow an analysis of what proportion of contributions are made as donations or fees.

Summary

Trends show that more taxpayers are using public school tax credits and schools are the recipients of an increasing amount of dollars, both in total and on a per pupil basis. Their popularity is likely due to key features of the program that are attractive to the taxpayer — a dollar for dollar credit on state income tax and the ability to target dollars for the benefit of a particular school or, in some cases, a particular child.

Tax credit contributions are appealing to public schools that have experienced significant budget cuts as a result of the state’s poor economy and legislative action.  Anecdotal evidence suggests that these increases may also be due to a greater public awareness of the tax credit brought about by a higher level of effort on the part of schools to raise that awareness and solicit funds.

Given that there is no cap placed on the amount of total dollars that a school may receive and the low rate of taxpayer participation to date, it is reasonable to expect that these trends will continue on their upward trajectory.  While the benefits and appeal to the taxpayer are undeniable—a dollar for dollar credit on the state income tax plus the ability to target the contribution—the broader effects of this policy are worth considering.

This is Part II of the Association’s four-part series on Tax Credits. Find Part I here, Part III here, and Part IV here.

Footnotes

[1] Internal Revenue Service, Individual Income and Tax Data, by State  (December 3, 2014).
Categories
Education Blog

Working for Public Students? A Look at Arizona’s Public Schools’ Tax Credits, Part I


Public school tax credits have steadily grown from $4 million to $400 million.  What may have been envisioned originally as a few extra dollars for extracurricular activities is now at nearly $50 per student.  The average tax credit revenue per student for an elementary school of 500 students is $25,000.  For a high school with 2,500, $125,000 is the average tax credit. In the context of recent cuts to education funding, this can be the difference between having extracurricular options for students or not.

The public school tax credit began in 1997 with the passage of HB2047 which was an innovative option for Arizona taxpayers to donate a portion of their income to public schools in return for a credit towards their state income tax.  Individual donations are capped at $200 (or $400 for those filing jointly) and can be used by public schools only for extracurricular activities, such as the purchase of band instruments or sports equipment, and character building programs, such as Character Counts. Tax credit donations may not be used to pay for core instructional or operational needs, such as instructional materials, teacher salaries, or building maintenance.

Figure 1: Tax Credit Revenues per Pupil, 2005 to 2013


Originally estimated to cost the state “$3.9 million beginning in FY 1998-1999,”[1] tax credits have become a significant source of revenue for Arizona schools, totaling over $400 million in the last nine years. Table 1 shows tax credit revenue to public schools in each year from 2005 and 2013.  Despite slight decreases during the Great Recession, the total amount has increased from $35.4 million in 2005 to nearly $51 million in 2013.

o account for changes in the student population, Figure 1 shows revenues per pupil over the last nine years.  This too shows the per pupil amount increasing overall during this time period, despite small setbacks during the Great Recession.

An upcoming report by the Association will take a closer look at the distribution of public school tax credit dollars. How many taxpayers are taking advantage of the tax credit and how much are they donating? Are all schools benefitting equally from this policy? Which schools benefit the most or the least? How are tax credit revenues used by schools?  By taking an unprecedented longitudinal look at tax credit revenues, the Association intends to shed some light on how this particular tax and education policy is playing out in our public schools.

This is Part I of the Association’s four-part series on Tax Credits. Find Part II here, Part III here, and Part IV here.

DATA AND METHODOLOGY

The primary data for this blog series consists of school-level tax credit amounts reported by schools for years 2005 through 2013. These files were obtained from the Arizona Department of Revenue [2] and include the total number of donations a school received, the total dollar amount received, and the total amount spent for each year.  Additionally, for years 2011-2013, these files contain information about tax credit expenditures by category.  To enhance our understanding of school-level characteristics, we linked the tax credit data to enrollment [3] and poverty data [4] obtained from the Arizona Department of Education.

The Department of Revenue collects data from each public school in the state and in most cases the data are reported for each school. In some cases, the data are reported as aggregated district amounts. For our analyses, we utilized all data reported, whether by district or by school, for all state summary tables and graphs. Where our analysis required school-level information, the district-level cases were omitted.

While the tax credit may be taken for either a general contribution or for fees, the Department of Revenue data does not draw a distinction. As a result, there is no way to know whether the amounts schools receive are donations that can be used at the discretion of the school, or whether they are in the form of fees that are, in practical terms, earmarked for a particular student.

For our expenditure analysis, we took each expenditure category listed in the tax credit file and summed them across schools to determine a statewide total expenditure by category.  Because several categories listed in the tax credit file overlap (i.e. “sports” and “athletics”), we chose to combine them.  These categories are athletic and sports programs, fine and performing arts, extended day and summer programs, cheerleading and rifle team, and driver’s education programs.

Footnotes:
[1] Arizona State Senate Staff Memo HB2047 dated March 19, 1997.
[2] Public School Tax Credit Reports, available at http://www.azdor.gov/ReportsResearch/SchoolTaxCredit.aspx
[3] Average Daily Membership Reports available at http://www.azed.gov/finance/reports/#SafrTop
[4] Percent of students who qualify for the National School Lunch Program, available http://www.azed.gov/health-nutrition/frpercentages/
Categories
Education Blog

Quality Seats in Arizona Increasing Over Time

The Association believes education leads to opportunities in life, and we work hard to make data transparent and actionable. As we look at Arizona’s A-F accountability system, we are asking whether our students are in quality seats.

For our purposes, a student is enrolled in a quality seat if they attend a Tier I school (A or B rating).  At the end of the day, we want to be able to measure the change in the number of quality public school seats available for students across Arizona — district and charter.

As the Association has pointed out in several of our publications, the relationship between poverty and measures of student achievement has long been a limitation of measurement of student achievement in education. The challenge for Arizona’s accountability model is to adequately control for the effect of poverty on the final school rating. As we noted in our publications, despite the inclusion of the student growth percentiles, the A-F model still has limited use in portraying school quality due to its failure to adequately control for the effects of poverty and fairly measure a school’s contribution to learning. However, all those issues notwithstanding, we still believe analyzing these data will provide insight into Arizona’s current accountability system.

A-F data published by the Arizona Department of Education in August indicates an overall increase in the percentage of A and B rated schools, with nearly 2 out of 3 schools achieving these results (62 percent of schools were rated A or B in the traditional model). To put this number in context, in 2012 54 percent of schools were rated A or B, in the traditional model. While it’s important to see the numbers of schools improving, we wanted to take a closer look at the number of students impacted by these improved letter grades.  In order to do this we designated each school into one of three tiers based on their A-F letter grade. Tier I represents all schools receiving an A or B rating; Tier 2 are C rated schools, and Tier 3 are schools earning a D or F rating.

We analyzed the data from the past three years of A-F accountability results to evaluate the trends in the number of quality seats. The following tables present the data for all public schools — district and charter — in each of the past three years. The number of students and the percentage of their enrollment is reported annually. The data show, as expected given the overall increase in the number of A and B rated schools, a larger number of students are enrolled in a quality seat in 2014 (69 percent) as compared to 2012 (62 percent).  As the number of Tier 1 seats increased, the number of Tier 2 and Tier 3 seats decreased, demonstrating an overall improvement in the number of seats available across Arizona. However, an alarming number of seats are not rated in 2014, more than double the number in 2013. It should be noted that the Arizona Department of Education has not yet finalized the “pending” schools which account for a large number of these seats without data.

These data present an alternative lens to evaluate the impact of Arizona’s school accountability measure.  Certainly, these results are affected by countless school improvement decisions at the classroom, school, LEA and state level (including the work of the Arizona State Board for Charter Schools).  No matter the decisions being made, these data make it clear that, at least according to our A-F results, more of our students are enrolled in a quality seat now than in 2012 when we started.

Categories
Education Blog

If Not Now, When Will We Improve the Data Used in Our Schools’ Letter Grades?

In 2012, the Association released School Ratings: Improving The Data In Data-Driven Decision Making where we examined the relationship between Arizona’s A-F school letter grades and the level of poverty in a school.  We found that a school’s letter grade is highly and negatively correlated with the percentage of its students who qualify for free and reduced priced lunch.  In other words, schools with high percentages of poor students received lower letter grades, on average, than schools with more affluent students.  This relationship is due, in great part, to the way in which Student Growth Percentiles (SGPs) are used in the accountability formula. Specifically, we found that the number of “growth points” awarded in the formula is artificially capped by the calculation which uses the averages of multiple medians.

After broadly communicating these concerns to state-level policy makers, which resulted in no changes to this portion of the A-F formula, we wondered if this was still the case in 2013 and 2014. As we expected, schools continued to earn most of their letter grade from the percentage of students who are proficient on AIMS (composite points). As the percentage of poor students in a school increases, the percentage passing continued to decrease (see Tables 1, 2 and 3). A closer look at the SGP scores show, as they did in 2012, that growth points remain consistent across poverty levels, meaning that growth is not strongly related to student demographics.

As in the initial 2012 report, we again call into question the implementation of the current accountability model.  State statute (ARS§ 15-241) clearly calls for equal weight to be assigned to student achievement and growth (50-50), what we continue to see is closer to 60-40, weighted toward AIMS passing scores, a measure highly related to poverty.

Evidence from three years of A-F results indicates that under this accountability model, schools with high levels of poverty are at a disadvantage.  For example, the difference in composite points between a school where less than 25 percent of its students qualify for free and reduced priced lunch and a school where more than 75 percent qualify is 29 points, or the difference between an A and C letter grade.  Given these consistent findings, we must ask ourselves “Is our school accountability model measuring school quality or student demographics?”

In the coming year, the Arizona Department of Education and the State Board of Education have the opportunity to develop a new school accountability model to reflect the change in the state’s new College and Career Ready Standards.  We encourage our state policymakers to consider this research and develop accountability models that more accurately measure school quality, rather than student demographics, so that schools with the toughest challenges aren’t disadvantaged.

Categories
Education Blog

Getting a Lot for a Little: How Schools are Using Instruction Hours

Over the past several decades politicians, parents and schools have significantly increased their expectations of public schools. Teachers and leaders are responsible for higher academic outcomes, while at the same time expected to support the social and emotional development of students.

Despite these increased expectations for greater outcomes and services, some still argue the need for expanded learning time. It’s true that the research is mixed on this issue, in part because it’s not always about how much you have but how well you use it.

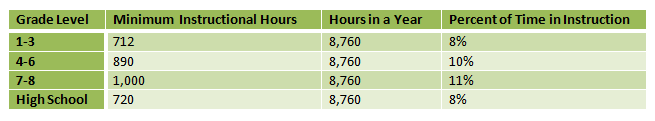
In Arizona, a full time student is defined in statute in terms of minimum instruction hours based on a 180-day school year (not counting recess, lunch, transition times between classes, etc.). To be clear, these instructional hours weren’t created to ensure that teachers had ample time to teach all of the standards expected of them or for students to have time to learn them. These hours were created to determine school funding and budgets.

In our most critical years, grades 1-3, students only spend 8 percent of their day receiving instruction in the following content areas: developmental reading, language arts, math, social studies, science, PE, art, music and health. This year, the pressure increased as Arizona implemented Move on When Reading, which requires schools to retain third-grade students that aren’t reading at grade level.


The table above presents the estimated time students spend in the classroom.* These instructional hours don’t reflect the increased rigor of Arizona’s College and Career Ready Standards or any of the other recent education reforms impacting schools.

Maybe it’s time that we ask ourselves some hard questions like: How much time does it take all students to learn what we’re asking of them? Do teachers have enough time to teach all of their students well? How much time does it take to accomplish our goals?

We suspect that the answers to those questions would increase instruction, costing far more money than what Arizona is paying now.

Where did the data come from?

The table above presents the number of instructional hours expected by grade range, the total hours per year (taking 365 days and multiply by 24 hours/day) and the percentage of a students’ life they spent receiving instruction (instructional hours divided by total hours).

Categories
Association Blog

2014 Candidate Survey

A Look at Candidate Support of K-12 Public Education

In June of 2014, the Arizona Charter Schools Association asked all candidates running for elected office in 2014 to participate in a survey that sought their perspectives on education in Arizona. The survey posed seven questions to candidates covering six topics including:

  • Parent Choice – Do you support a parent’s right to choose the best public school, in their judgment, for their children?
  • Charter Schools – Do you support public charter schools in Arizona?
  • Charter Autonomy – Do you support continued autonomy for proven, high quality charter schools?
  • Equitable Funding – Do you support public charter school students receiving the same amount of public funding as students in other public schools?
  • Facilities – Do you support allowing public charter schools the ability to lease or purchase unused school district facilities at fair market value?
  • Improve K-12 Education – Where do you rank improving K-12 education in Arizona among your overall priorities?
  • Greatest Challenges – What is the greatest challenge facing public education in Arizona today?

Nearly one in three candidates responded to the public survey, with responses received from every public office on the 2014 primary ballot.

Categories
Education Blog

We Shouldn’t Take Growth for Granted

Population growth has been a crucial part of Arizona’s economic engine. This population growth is reflected in the increasing number of students enrolled in K-12 education and the increasing number of public schools, both district and charter. According to national statistics, our growth is expected to continue; the National Center for Education Statistics currently projects that Arizona’s K-12 population will grow by 20 percent between 2010 and 2021.

A recent look at enrollment trends for the last 17 years confirms the growth trajectory of public school enrollment in Arizona, but it also shows recent inconsistencies in that trajectory. The graphic below shows the total K-12 enrollment in Arizona from 1996 to 2013.  Over this period of time, enrollment swelled from 723,000 to 1.05 million students, an increase of 46 percent. For most of that time the growth was consistent— increasing by about 2 to 4 percent each year. However, starting in 2009, the state’s student enrollment begins to fluctuate. The decreases are small—6,000 fewer students in 2009, 2,300 fewer students in 2011, and another 2,000 in 2012—but potentially significant. The rate of growth did not just slow down in some years, but the number of students decreased for the first time in at least 13 years.

April14BlogPic

Given the year after year of growth prior to 2009, the first question that comes to mind is, “What happened?” The economic recession is a plausible explanation. So too may be the anti-immigrant policies which began in 2007. Without more detailed population and student demographic data, along with economic measures, such as Arizona’s gross domestic product, foreclosure or unemployment rates, we cannot answer this question.

The second question we asked ourselves is, “Why does it matter?” It matters to the state because our economy has relied heavily on growth. And it matters to schools, in particular, because school funding is based on student enrollment and it is provided to schools on a “per pupil” basis. Not only did public schools see a dramatic decline in resources due to the economic recession, they also saw a decline in resources due to the loss in enrollment.

No one expects Arizona to decrease in population or students in public schools over the long term, even when taking into account the fluctuations in recent years. At worst, we will not grow as much as we once believed. The National Center for Education Statistics’ 2011 report, projected that Arizona would grow by 26% from 2008 to 2020 (using actual enrollments through 2008) but adjusted the projection to 20% by 2021 when it incorporated actual enrollments through 2010.

However, short term fluctuations in enrollment—even relatively small ones—can still have a significant impact, particularly if they occur only in certain parts of the state or affect only certain school districts or groups of students. The Association will look at more detailed enrollment information, along with other demographic and economic indicators, to understand better “what happened?” and determine whether these fluctuations vary across the state or among groups of students.

Categories
Education Blog

Do You Know How Many Third Graders Will Fail?


If an eight-year-old child fails Arizona’s reading test on April 7, Arizona law requires that child to repeat third grade[i].  If 2014 AIMS results are consistent with 2013, then up to four percent of our third grade students will be retained, according to the Arizona Department of Education[ii].  That means about 3,359 children will be told before their ninth birthday that they cannot move on to fourth grade with their friends and peers.

So as a parent or governing board member, how many students in your school are affected?  Here are questions to ask:

Parents should be asking the school’s administration:

  1. Is my child on track to pass the AIMS test this year?
  2. If not, what interventions are you trying and how do you know they are working?
  3. What can I do at home to help?

Governing boards and concerned community members should be asking the administration:

  1. How many students are at risk for failure?
  2. How many are eligible for “good cause” exemptions?
  3. How do these data vary by school in our district?
  4. Which students are most at risk?
  5. What are we doing to prevent this? How do we know it is working?
  6. How are we working with parents to communicate this information and support their children?
  7. What can I do to help?


[i] http://www.azleg.gov/ars/15/00701.htm
[ii] http://www.azed.gov/research-evaluation/aims-assessment-results/
Categories
Association Blog

Charter School Participation in State Retirement Systems

The Issue

Allowing Arizona charter school employees to participate in the state retirement system was a decision made by the Arizona legislature in 1994. Now, the Internal Revenue Service wants to prohibit Arizona from allowing our 12,000 current and former charter school employees in the state retirement system.

The IRS, a bureau of the Department of Treasury, proposed regulation that would force charter employees enrolled in state retirement system to either leave their charter schools or lose their accrued pension wealth. We cannot allow these regulations, listed as “Determination of Government Plan Status,” to be adopted in their current form.

The regulations proposed by the IRS are part of the rule making process, which are not subject to a vote by Congress and are not legislation. Instead, they’re required to use their expertise and experience to come up with the best policies. The public can comment on the proposed rules, which is where we are now. The Treasury extended the deadline for public comments on the proposed rule from February 6 to June 18, 2012. They held a hearing on the rule on July 9, 2012.

Updates

July 11, 2012 — The IRS held a public hearing on Monday, July 9 to discuss the potential regulation change that could affect 95,000 public charter school employees nationwide. The National Alliance for Public Charter Schools and two other state charter associations testified in support of charter employees. Although the proposed regulation doesn’t specifically mention charter schools, it describes entities a lot like charter schools and excludes them from state retirement systems. We want the IRS to incorporate our suggestions to into the next round of their drafts, ensuring charter employees are still allowed to participate in state sponsored retirement systems. After the next draft is released, there will be another public hearing. The IRS is only in the preliminary stages of this process, and it could take years before the proposed regulations become official.

March 8, 2012 — Issues regarding the Internal Revenue Service’s proposed regulation affecting charter employees participating in state retirement systems continue to unfold. Thank you for engaging your congressional delegation on this issue – you and your charter school communities are being heard! Due to your grassroots action in sending messages to Congress and Administration officials, we have several significant victories, including:

  • On Thursday, March 1, 17 members of the U.S. House of Representatives sent a bipartisan letter to IRS Commissioner Doug Shulman, embracing our concerns and urging the IRS to adopt our position.
  •  Education Sector issued a report titled, “A Legal Guide to State Pension Reform.” Although the report is not specific to charter schools, it details how laws protecting state pension benefits vary dramatically from state to state. Please review this report to understand how Arizona’s laws may or may not protect charter employees’ retirement wealth, should modifications to existing plans happen (either because of the IRS draft Proposed Regulations or because of political pressure to reform state pension plans).
  • Through your efforts, over 1,200 people have sent nearly 6,600 emails. Across the nation over 43,000 emails were sent.
  • The Internal Revenue Service extend the public comment period until June 18, 2012 and said in a statement that public charter schools were not intended to be impacted by the draft proposal.

The Treasury Department and Internal Revenue Service have confirmed that our messages have had a direct effect on the extension of the public comment deadline. The tens of thousands of emails sent via the Association and other charter organizations allowed our concerns to be heard and produced a positive reaction for the charter community. At this point, the threat appears minimal to charter employees; however, this issue is far from resolved or decided, and we must remain diligent, informed and involved.