Categories
Education Blog

A Closer Look at Arizona’s Largest Charter Organizations

The Arizona Legislature recently ended its 2015 session and one of the more significant pieces of education policy to emerge from it is the recognition of charter school “networks,” or groups of affiliated charter school organizations.  In short, the Legislature has determined that charter schools that are part of a network should be treated as one organization, rather than individual entities, for the purpose of state funding. The result is that these charter school networks are funded similarly as traditional school districts.

Since 1994, Arizona has treated charter schools as independent entities, even if they are part of a larger group of charter schools.  As a result, little information exists about the number of charter “networks” that exist or how large they are. The Association has combined information from the Arizona Department of Education with charter school affiliations collected by the Arizona Charter Schools Association to begin to fill the information gap.

Taking this new view of charter schools, Arizona has 267 unique charter organizations, where some are networks of affiliated schools and others are a single school campus operating independent of any other school or charter organization.  Combined, all charter organizations in the state enrolled nearly 150,000 students in 2014 and nearly 160,000 students in 2015, excluding district-sponsored charter schools.

Table 1 shows that in the last two years, the ten largest charter organizations — networks and single charter organizations — enrolled nearly 40 percent of all charter students.  In 2015, the two largest organizations enrolled nearly 11 percent of charter students.

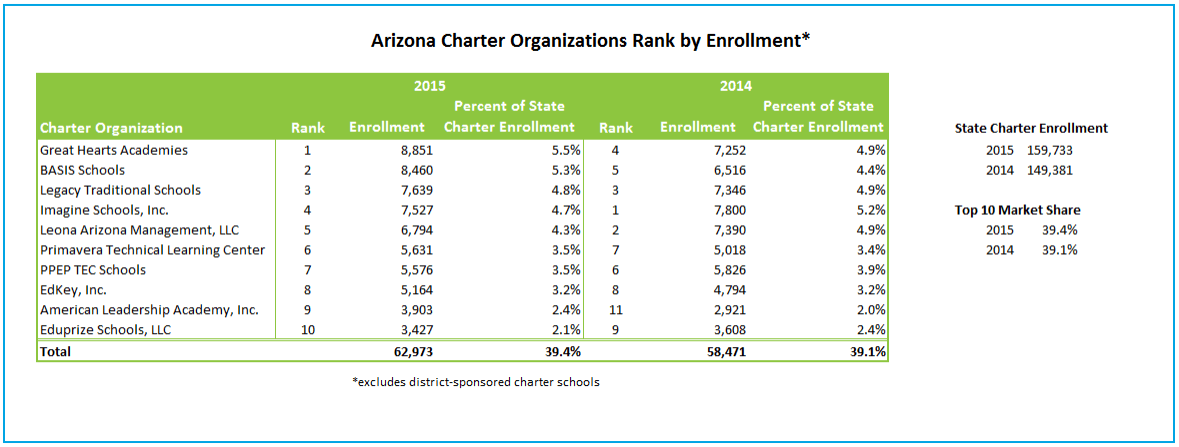
The table also shows the relative ranking of charter organizations based on their share of charter student enrollment.  Nine out of ten charter organizations appear on both lists; however there is movement in the rankings.  For example, Great Hearts Academies rose from fourth to first, while Imagine Schools dropped from first to fourth. These data demonstrate that eight out of the ten schools relative rankings shifted from 2014 to 2015, all but Legacy Traditional Schools and EdKey, Inc. This suggests that while there is a concentration of charter enrollment in the state’s largest charter organizations, enrollment patterns within this group varies.

It is unclear from these data the reasons why these networks are successful in enrolling a large proportion of the state’s charter students. However, these data provide an opportunity to ask questions about the types of schools parents are choosing to enroll their children. These charter organizations represent a variety of instructional models from back to basics to online, indicating that a large number of families are making enrollment choices across instructional methods.  Additionally, the top three networks in the 2015 rankings represent schools that focus on academic rigor and college and career readiness through their unique instructional methods.  Whereas, in the 2014 rankings, one of the top three networks, Leona Arizona Management, LLC, has diverse curriculum at its schools, including several that focus on students who have been unsuccessful in traditional settings.

These data also present additional policy and research questions for the future. How are the innovation, flexibility, and freedom from bureaucracy at the heart of the charter movement kept alive in these large charter organizations? If enrollment continues to concentrate in larger charter organizations, what is the future of the small, independent charter school? And most importantly, what does all this mean for students?

Categories
Education Blog

What About Poverty? Food for Thought on the Classroom Spending Debate

Educating children often requires much more than quality instruction; most educators agree on the need to offer services that meet students’ social, emotional, and material needs if students are to succeed in the classroom[1]. Depending on the school, grade level, and student demographics, these additional needs can take the form of school counselors, social workers, before and after school programs, or parent outreach. Such services have been a part of the recent discussion around classroom vs. non-classroom spending.

Missing from the conversations about spending is an acknowledgement of the percentage of students in Arizona public schools who are living in poverty and as a result are more likely to need and benefit from “non-classroom” services.  In the coming year, schools will likely face further reductions in budgets and increased pressure to “put more money in the classroom.”  In order to provide some context and insight into the challenges facing Arizona public schools, the Association feels that it is beneficial to examine statewide trends in student poverty[2].

The graph presents statewide student enrollment in Arizona’s public schools and the number of students who qualified for free and reduced price lunch during the past 10 years[3].  As the graph shows, overall enrollment in Arizona public schools has fluctuated at just over one million students during this time. In comparison, the data indicate a steady increase in the percent of students eligible for free and reduced price lunch from 2007-2008 through 2013-14. In the most recent year, there is a slight decrease (-3%) reported.

The slight decrease in poverty in 2014-2015 may be an indicator of economic recovery and if it continues one would expect a decrease in the demand for student supports in schools as fewer families live in poverty.  All other school spending being equal, one would expect a corresponding increase in the percent of funding that goes to the classroom.

The relationship between poverty and the percent of funding that goes inside or outside of the classroom is a research and policy question worth pursuing. The insights gained from this research can help policymakers understand the larger economic dynamics at work in Arizona’s public schools.  These data may be useful in determining whether the percent of dollars spent outside of the classroom is a reflection of inefficiencies in the system, as it is often portrayed, or a reflection of the level of need in the student population.  The Association believes that these data are important for policy makers to consider as they begin to better understand the context of school level expenditures.
Footnotes
[1] Moore, K.A., & Emig, C. (2014). Integrated student supports: A summary of the evidence base for policymakers. Bathesda, MD: Child Trends.  Retrieved on 5/1/15 from http://www.childtrends.org/wp-content/uploads/2014/02/2014-05ISSWhitePaper3.pdf.
[2] Data for this analysis were taken from the “Average Daily Membership” (ADM) and “Percentage of Children Approved for Free or Reduced-Price Lunches” files made publicly available by the Arizona Department of Education.
[3] We acknowledge that eligibility for free and reduced price lunch is a proxy indicator of poverty and that there are limitations to its usefulness. Schools that do not participate in the National School Lunch Program do not have FRL data and there are a number of reasons why schools may not participate in the program.  However, this does not mean that these schools do not enroll poor children.  As a result, the numbers reported by the state should be considered conservative estimates.
Categories
Education Blog

We Shouldn’t Take Growth for Granted

Population growth has been a crucial part of Arizona’s economic engine. This population growth is reflected in the increasing number of students enrolled in K-12 education and the increasing number of public schools, both district and charter. According to national statistics, our growth is expected to continue; the National Center for Education Statistics currently projects that Arizona’s K-12 population will grow by 20 percent between 2010 and 2021.

A recent look at enrollment trends for the last 17 years confirms the growth trajectory of public school enrollment in Arizona, but it also shows recent inconsistencies in that trajectory. The graphic below shows the total K-12 enrollment in Arizona from 1996 to 2013.  Over this period of time, enrollment swelled from 723,000 to 1.05 million students, an increase of 46 percent. For most of that time the growth was consistent— increasing by about 2 to 4 percent each year. However, starting in 2009, the state’s student enrollment begins to fluctuate. The decreases are small—6,000 fewer students in 2009, 2,300 fewer students in 2011, and another 2,000 in 2012—but potentially significant. The rate of growth did not just slow down in some years, but the number of students decreased for the first time in at least 13 years.

April14BlogPic

Given the year after year of growth prior to 2009, the first question that comes to mind is, “What happened?” The economic recession is a plausible explanation. So too may be the anti-immigrant policies which began in 2007. Without more detailed population and student demographic data, along with economic measures, such as Arizona’s gross domestic product, foreclosure or unemployment rates, we cannot answer this question.

The second question we asked ourselves is, “Why does it matter?” It matters to the state because our economy has relied heavily on growth. And it matters to schools, in particular, because school funding is based on student enrollment and it is provided to schools on a “per pupil” basis. Not only did public schools see a dramatic decline in resources due to the economic recession, they also saw a decline in resources due to the loss in enrollment.

No one expects Arizona to decrease in population or students in public schools over the long term, even when taking into account the fluctuations in recent years. At worst, we will not grow as much as we once believed. The National Center for Education Statistics’ 2011 report, projected that Arizona would grow by 26% from 2008 to 2020 (using actual enrollments through 2008) but adjusted the projection to 20% by 2021 when it incorporated actual enrollments through 2010.

However, short term fluctuations in enrollment—even relatively small ones—can still have a significant impact, particularly if they occur only in certain parts of the state or affect only certain school districts or groups of students. The Association will look at more detailed enrollment information, along with other demographic and economic indicators, to understand better “what happened?” and determine whether these fluctuations vary across the state or among groups of students.