[pexyoutube pex_attr_src=”https://www.youtube.com/watch?v=TSYM5tkfP_M”][/pexyoutube]
Arizona Charter Schools Association President Eileen Sigmund appeared on Fox 10’s Newsmaker Sunday to discuss the biggest hurdles facing Arizona schools.
[pexyoutube pex_attr_src=”https://www.youtube.com/watch?v=TSYM5tkfP_M”][/pexyoutube]
Arizona Charter Schools Association President Eileen Sigmund appeared on Fox 10’s Newsmaker Sunday to discuss the biggest hurdles facing Arizona schools.
During a segment on Arizona Horizon, Arizona Charter Schools Association President Eileen Sigmund discussed how charter schools fared during the 2015 legislative session.
Over the last few months, we’ve brought you an analysis of Arizona’s public school tax credits, how they’ve changed from 2005-2013, and which schools benefit from them. Find our first blog here and our second blog here and our third blog here. For our final blog post on this topic, we will describe the types of programs that public school tax credits currently support. Our analysis uses 2013’s data which is the most recent year available from the Arizona Department of Revenue.
The law allows public school tax credits for extracurricular activities defined as “school sponsored activities that require enrolled students to pay a fee in order to participate including fees for band uniforms, equipment or uniforms for varsity athletic activities, and scientific laboratory materials [1].” In 1997, lawmakers expanded eligible programs to include “character education.” Character education programs must emphasize positive character traits like truthfulness, responsibility, compassion, diligence, and sincerity [2].
In 2013, Arizona public schools spent just under $50,000,000 of their tax credit donations, the largest portion of which was spent on sports and athletic programs ($13,715,249). The next largest expenditure categories were field trips ($9,613,643) and fine and performing arts ($8,436,035). Combined, these three categories comprised over 50% of tax credit expenditures in 2013 or just under $32,000,000.
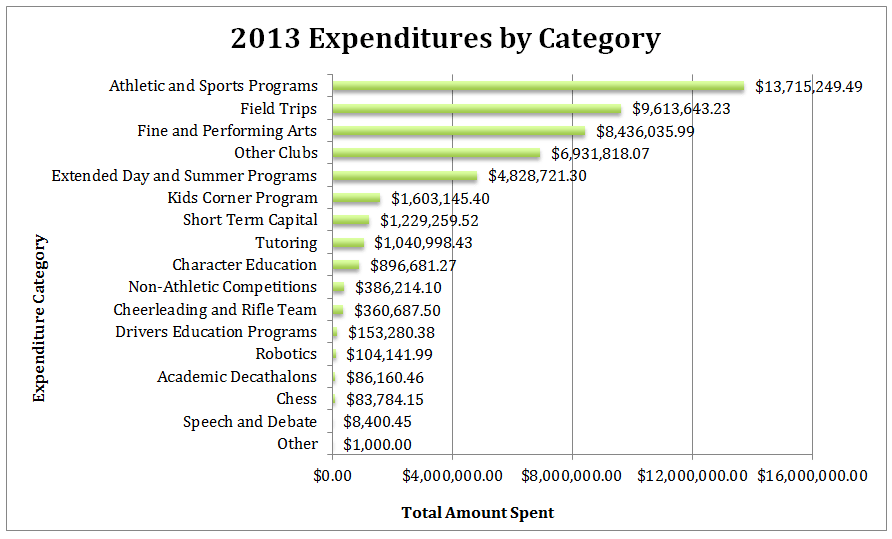
Our previous analyses have shown that public school tax credit contributions continue to increase annually and that these contributions are increasingly benefiting more affluent students while donations at high-poverty schools have remained relatively low and stagnate over the last nine years. These expenditure data suggest that a significant amount of tax credit contributions are funding fee-based activities and a relatively small amount is funding character education or scientific laboratory materials, as the law suggests.
The primary data for this blog series consists of school-level tax credit amounts reported by schools for years 2005 through 2013. These files were obtained from the Arizona Department of Revenue [3] and include the total number of donations a school received, the total dollar amount received, and the total amount spent for each year. Additionally, for years 2011-2013, these files contain information about tax credit expenditures by category. To enhance our understanding of school-level characteristics, we linked the tax credit data to enrollment [4] and poverty data [5] obtained from the Arizona Department of Education.
The Department of Revenue collects data from each public school in the state and in most cases the data are reported for each school. In some cases, the data are reported as aggregated district amounts. For our analyses, we utilized all data reported, whether by district or by school, for all state summary tables and graphs. Where our analysis required school-level information, the district-level cases were omitted.
While the tax credit may be taken for either a general contribution or for fees, the Department of Revenue data does not draw a distinction. As a result, there is no way to know whether the amounts schools receive are donations that can be used at the discretion of the school, or whether they are in the form of fees that are, in practical terms, earmarked for a particular student.
For our expenditure analysis, we took each expenditure category listed in the tax credit file and summed them across schools to determine a statewide total expenditure by category. Because several categories listed in the tax credit file overlap (i.e. “sports” and “athletics”), we chose to combine them. These categories are athletic and sports programs, fine and performing arts, extended day and summer programs, cheerleading and rifle team, and driver’s education programs.
[1] Arizona State Legislature Private School Tuition; Tax Credit (E) A.R.S. § 43-1088 (1997) (December 1, 2014).
[2] Arizona State Legislature Character Education Program Instruction; fund A.R.S. § 15-719 (December 1, 2014)
Our initial analysis of public school tax credits showed an increase in overall contributions during the nine years analyzed. Find our first blog here and our second blog here. The next question the Association sought to answer was which public schools have benefited from tax credits and to what extent.
In order to determine which public schools benefit from public school tax credit contributions, we looked at the variability in per pupil contributions across all schools. Figure 1 shows the relative size differences in per pupil tax credit contributions for schools in 2013, the most recent year these data were available.
FIGURE 1: Variation in Per Pupil Tax Credit Contributions to Schools, 2013
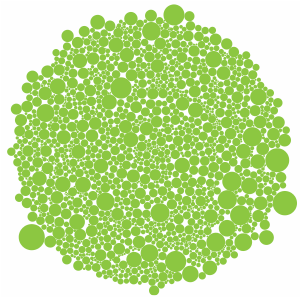
It is clear from this simple visual that the amount of tax credit contributions schools receive varies significantly. Some schools may receive little or no funding per pupil, while other schools receive hundreds of dollar per pupil in tax credit contributions.
What might account for these differences?
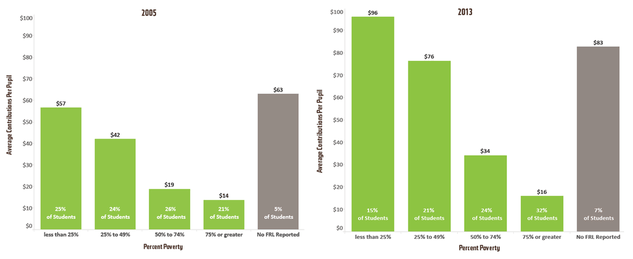
Public school tax credits are voluntary contributions made to schools by individual taxpayers. Schools rely largely on parents to make tax credit contributions, particularly if these are collected as fees for extra-curricular activities rather than general contributions to the school. They also rely on their communities and often promote on their websites, district newsletters or advertise in local media to get the word out about tax credit contributions. It is not unusual to see a solicitation on a community bulletin board or a movie theater screen prior to the feature. The success of these efforts will likely be dependent on the income level of parents and the local community.
In order to determine whether there is a relationship between a school’s level of poverty and the amount of contributions that a school receives, we linked the public school tax credit data to school-level percentage of students eligible for free or reduced-priced lunch (FRL) as part of the National School Lunch Program.
Although it is not without some limitations, percent FRL is the best available proxy for the level of poverty in an Arizona school. For this analysis, we divided schools into five categories:
FRL Data
The primary data for this blog series consists of school-level tax credit amounts reported by schools for years 2005 through 2013. These files were obtained from the Arizona Department of Revenue [1] and include the total number of donations a school received, the total dollar amount received, and the total amount spent for each year. Additionally, for years 2011-2013, these files contain information about tax credit expenditures by category. To enhance our understanding of school-level characteristics, we linked the tax credit data to enrollment [2] and poverty data [3] obtained from the Arizona Department of Education.
The Department of Revenue collects data from each public school in the state and in most cases the data are reported for each school. In some cases, the data are reported as aggregated district amounts. For our analyses, we utilized all data reported, whether by district or by school, for all state summary tables and graphs. Where our analysis required school-level information, the district-level cases were omitted.
While the tax credit may be taken for either a general contribution or for fees, the Department of Revenue data does not draw a distinction. As a result, there is no way to know whether the amounts schools receive are donations that can be used at the discretion of the school, or whether they are in the form of fees that are, in practical terms, earmarked for a particular student.
For our expenditure analysis, we took each expenditure category listed in the tax credit file and summed them across schools to determine a statewide total expenditure by category. Because several categories listed in the tax credit file overlap (i.e. “sports” and “athletics”), we chose to combine them. These categories are athletic and sports programs, fine and performing arts, extended day and summer programs, cheerleading and rifle team, and driver’s education programs.
[1] Public School Tax Credit Reports, available at http://www.azdor.gov/ReportsResearch/SchoolTaxCredit.aspx
[2] Average Daily Membership Reports available at http://www.azed.gov/finance/reports/#SafrTop
[3] Percent of students who qualify for the National School Lunch Program, available http://www.azed.gov/health-nutrition/frpercentages/
 The Arizona Charter Schools Association is pleased to announce a new member to its Board of Directors, Beatriz Rendón, Senior Associate Vice President of Educational Outreach and Student Services at Arizona State University. See an article in the Phoenix Business Journal here.
Rendón is responsible for building and diversifying the pipeline of college going students into ASU, which includes her position as the Chief Executive Officer of ASU Preparatory Academy. The K-12 public charter school currently serves over 2,000 students in grades PreK-12.
As an education expert on the Association’s Board of Directors, Rendón will advise Arizona’s largest charter support organization in its mission to support student achievement though high-quality charter schools, advocate for student equity and charter school autonomy, and lead Arizona charter schools as a sustainable, strong and credible organization.
Continuing our look at Arizona’s public school tax credits, Table 2 shows the statewide trend in the number of contributions and the average contribution amount. A contribution may be a single person or a couple, so the number of contributions does not precisely reflect the number of taxpayers who are using the tax credit, but it does provide a useful indicator of the change in the level of taxpayer participation. To put this number in perspective, in 2012, Arizona residents filed over 2.7 million state income tax returns [1], suggesting fewer than ten percent of filers are using public school tax credits.
Table 2: Number and Average Contributions, 2005-2013
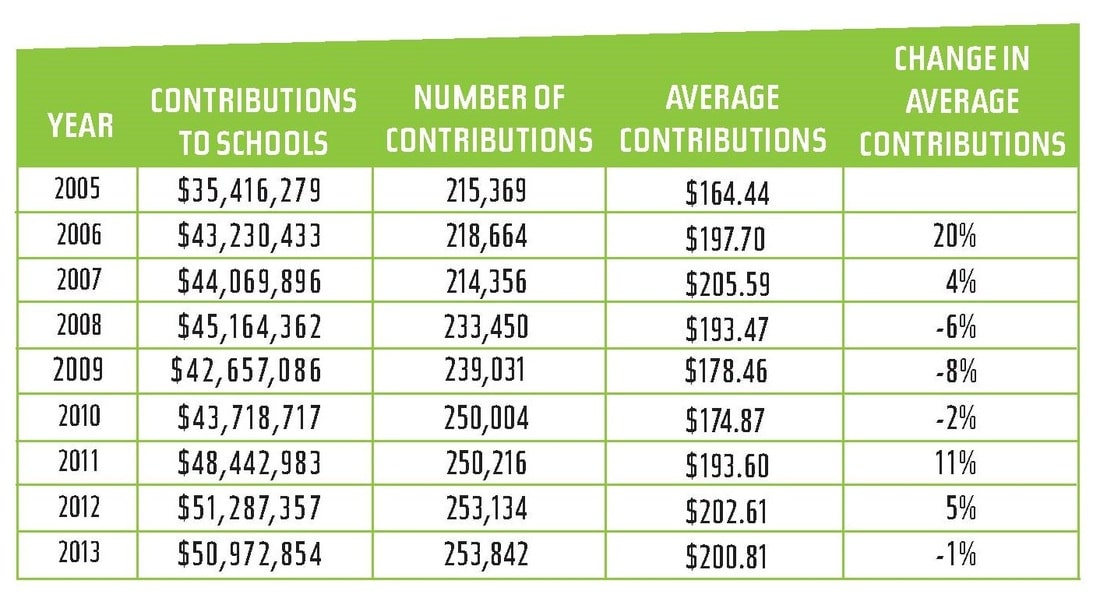
The number of contributions increased a total of 18% from 2005 to 2013. This rate is less than half of the 44% increase in the total contributions received by public schools in these years. This can be explained by the fact that the average contribution amount increased 22% during the same period of time, although it did fluctuate somewhat during these years. In other words, more people are contributing larger amounts of money.
It should be noted that the taxpayer may take the tax credit for a donation to a public school or for the payment of fees associated with a student’s extra-curricular activities. For example, a parent may make a $200 contribution to support a school’s athletic programs and take a $200 tax credit, or she can pay $200 in fees associated with her child’s participation in the school’s basketball team and take the same $200 tax credit (or a combination, within the allowable limits). Available data do not allow an analysis of what proportion of contributions are made as donations or fees.
Trends show that more taxpayers are using public school tax credits and schools are the recipients of an increasing amount of dollars, both in total and on a per pupil basis. Their popularity is likely due to key features of the program that are attractive to the taxpayer — a dollar for dollar credit on state income tax and the ability to target dollars for the benefit of a particular school or, in some cases, a particular child.
Tax credit contributions are appealing to public schools that have experienced significant budget cuts as a result of the state’s poor economy and legislative action. Anecdotal evidence suggests that these increases may also be due to a greater public awareness of the tax credit brought about by a higher level of effort on the part of schools to raise that awareness and solicit funds.
Given that there is no cap placed on the amount of total dollars that a school may receive and the low rate of taxpayer participation to date, it is reasonable to expect that these trends will continue on their upward trajectory. While the benefits and appeal to the taxpayer are undeniable—a dollar for dollar credit on the state income tax plus the ability to target the contribution—the broader effects of this policy are worth considering.
Footnotes
The public school tax credit began in 1997 with the passage of HB2047 which was an innovative option for Arizona taxpayers to donate a portion of their income to public schools in return for a credit towards their state income tax. Individual donations are capped at $200 (or $400 for those filing jointly) and can be used by public schools only for extracurricular activities, such as the purchase of band instruments or sports equipment, and character building programs, such as Character Counts. Tax credit donations may not be used to pay for core instructional or operational needs, such as instructional materials, teacher salaries, or building maintenance.
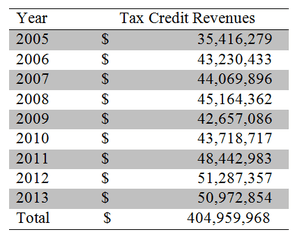
Originally estimated to cost the state “$3.9 million beginning in FY 1998-1999,”[1] tax credits have become a significant source of revenue for Arizona schools, totaling over $400 million in the last nine years. Table 1 shows tax credit revenue to public schools in each year from 2005 and 2013. Despite slight decreases during the Great Recession, the total amount has increased from $35.4 million in 2005 to nearly $51 million in 2013.
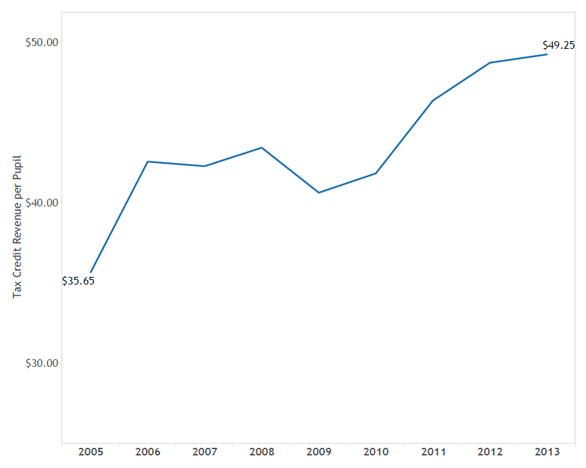
o account for changes in the student population, Figure 1 shows revenues per pupil over the last nine years. This too shows the per pupil amount increasing overall during this time period, despite small setbacks during the Great Recession.
This is Part I of the Association’s four-part series on Tax Credits. Find Part II here, Part III here, and Part IV here.
The primary data for this blog series consists of school-level tax credit amounts reported by schools for years 2005 through 2013. These files were obtained from the Arizona Department of Revenue [2] and include the total number of donations a school received, the total dollar amount received, and the total amount spent for each year. Additionally, for years 2011-2013, these files contain information about tax credit expenditures by category. To enhance our understanding of school-level characteristics, we linked the tax credit data to enrollment [3] and poverty data [4] obtained from the Arizona Department of Education.
The Department of Revenue collects data from each public school in the state and in most cases the data are reported for each school. In some cases, the data are reported as aggregated district amounts. For our analyses, we utilized all data reported, whether by district or by school, for all state summary tables and graphs. Where our analysis required school-level information, the district-level cases were omitted.
While the tax credit may be taken for either a general contribution or for fees, the Department of Revenue data does not draw a distinction. As a result, there is no way to know whether the amounts schools receive are donations that can be used at the discretion of the school, or whether they are in the form of fees that are, in practical terms, earmarked for a particular student.
For our expenditure analysis, we took each expenditure category listed in the tax credit file and summed them across schools to determine a statewide total expenditure by category. Because several categories listed in the tax credit file overlap (i.e. “sports” and “athletics”), we chose to combine them. These categories are athletic and sports programs, fine and performing arts, extended day and summer programs, cheerleading and rifle team, and driver’s education programs.
The Association believes education leads to opportunities in life, and we work hard to make data transparent and actionable. As we look at Arizona’s A-F accountability system, we are asking whether our students are in quality seats.
For our purposes, a student is enrolled in a quality seat if they attend a Tier I school (A or B rating). At the end of the day, we want to be able to measure the change in the number of quality public school seats available for students across Arizona — district and charter.
As the Association has pointed out in several of our publications, the relationship between poverty and measures of student achievement has long been a limitation of measurement of student achievement in education. The challenge for Arizona’s accountability model is to adequately control for the effect of poverty on the final school rating. As we noted in our publications, despite the inclusion of the student growth percentiles, the A-F model still has limited use in portraying school quality due to its failure to adequately control for the effects of poverty and fairly measure a school’s contribution to learning. However, all those issues notwithstanding, we still believe analyzing these data will provide insight into Arizona’s current accountability system.
A-F data published by the Arizona Department of Education in August indicates an overall increase in the percentage of A and B rated schools, with nearly 2 out of 3 schools achieving these results (62 percent of schools were rated A or B in the traditional model). To put this number in context, in 2012 54 percent of schools were rated A or B, in the traditional model. While it’s important to see the numbers of schools improving, we wanted to take a closer look at the number of students impacted by these improved letter grades. In order to do this we designated each school into one of three tiers based on their A-F letter grade. Tier I represents all schools receiving an A or B rating; Tier 2 are C rated schools, and Tier 3 are schools earning a D or F rating.
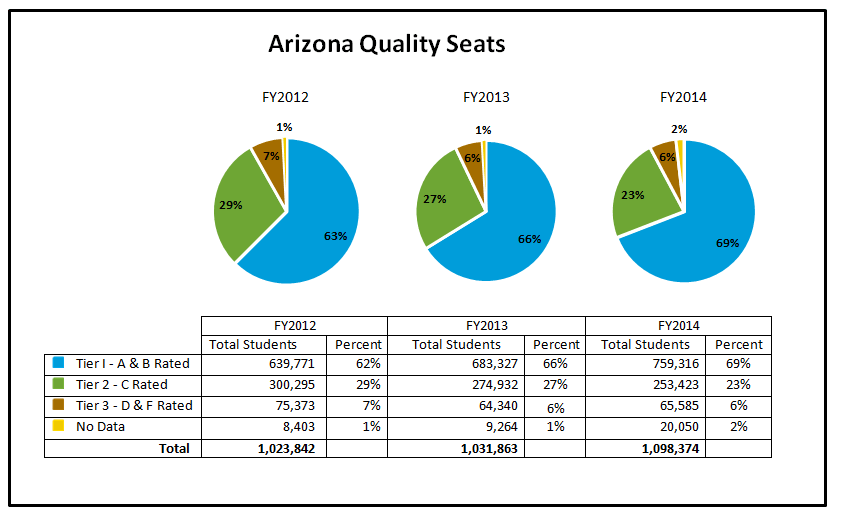
We analyzed the data from the past three years of A-F accountability results to evaluate the trends in the number of quality seats. The following tables present the data for all public schools — district and charter — in each of the past three years. The number of students and the percentage of their enrollment is reported annually. The data show, as expected given the overall increase in the number of A and B rated schools, a larger number of students are enrolled in a quality seat in 2014 (69 percent) as compared to 2012 (62 percent). As the number of Tier 1 seats increased, the number of Tier 2 and Tier 3 seats decreased, demonstrating an overall improvement in the number of seats available across Arizona. However, an alarming number of seats are not rated in 2014, more than double the number in 2013. It should be noted that the Arizona Department of Education has not yet finalized the “pending” schools which account for a large number of these seats without data.
These data present an alternative lens to evaluate the impact of Arizona’s school accountability measure. Certainly, these results are affected by countless school improvement decisions at the classroom, school, LEA and state level (including the work of the Arizona State Board for Charter Schools). No matter the decisions being made, these data make it clear that, at least according to our A-F results, more of our students are enrolled in a quality seat now than in 2012 when we started.
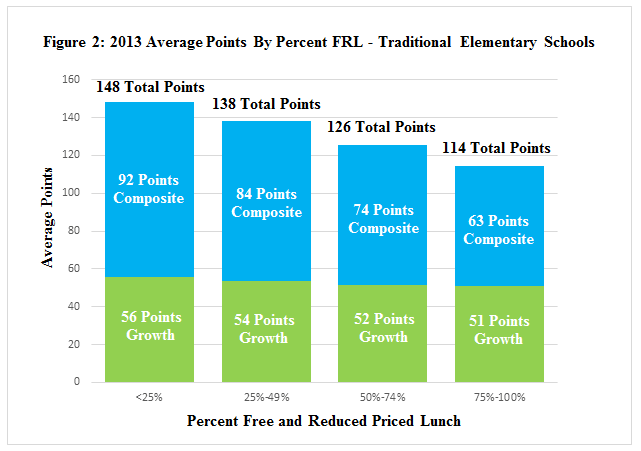
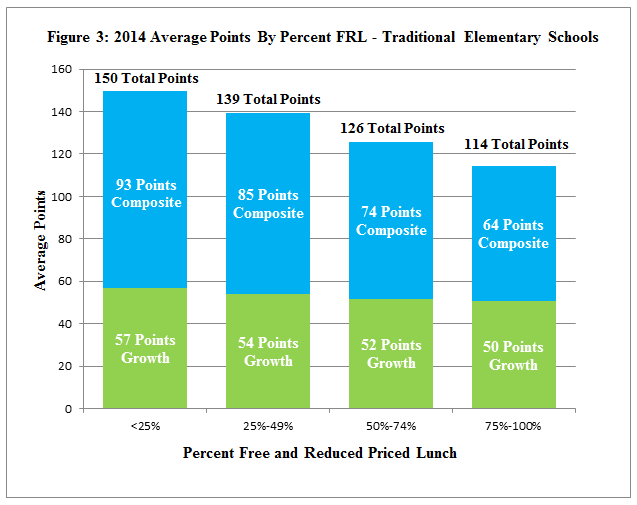
In 2012, the Association released School Ratings: Improving The Data In Data-Driven Decision Making where we examined the relationship between Arizona’s A-F school letter grades and the level of poverty in a school. We found that a school’s letter grade is highly and negatively correlated with the percentage of its students who qualify for free and reduced priced lunch. In other words, schools with high percentages of poor students received lower letter grades, on average, than schools with more affluent students. This relationship is due, in great part, to the way in which Student Growth Percentiles (SGPs) are used in the accountability formula. Specifically, we found that the number of “growth points” awarded in the formula is artificially capped by the calculation which uses the averages of multiple medians.
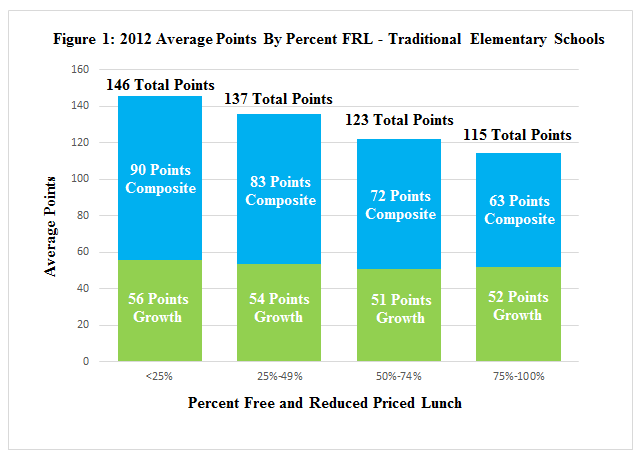
After broadly communicating these concerns to state-level policy makers, which resulted in no changes to this portion of the A-F formula, we wondered if this was still the case in 2013 and 2014. As we expected, schools continued to earn most of their letter grade from the percentage of students who are proficient on AIMS (composite points). As the percentage of poor students in a school increases, the percentage passing continued to decrease (see Tables 1, 2 and 3). A closer look at the SGP scores show, as they did in 2012, that growth points remain consistent across poverty levels, meaning that growth is not strongly related to student demographics.
As in the initial 2012 report, we again call into question the implementation of the current accountability model. State statute (ARS§ 15-241) clearly calls for equal weight to be assigned to student achievement and growth (50-50), what we continue to see is closer to 60-40, weighted toward AIMS passing scores, a measure highly related to poverty.
Evidence from three years of A-F results indicates that under this accountability model, schools with high levels of poverty are at a disadvantage. For example, the difference in composite points between a school where less than 25 percent of its students qualify for free and reduced priced lunch and a school where more than 75 percent qualify is 29 points, or the difference between an A and C letter grade. Given these consistent findings, we must ask ourselves “Is our school accountability model measuring school quality or student demographics?”
In the coming year, the Arizona Department of Education and the State Board of Education have the opportunity to develop a new school accountability model to reflect the change in the state’s new College and Career Ready Standards. We encourage our state policymakers to consider this research and develop accountability models that more accurately measure school quality, rather than student demographics, so that schools with the toughest challenges aren’t disadvantaged.
Over the past several decades politicians, parents and schools have significantly increased their expectations of public schools. Teachers and leaders are responsible for higher academic outcomes, while at the same time expected to support the social and emotional development of students.
Despite these increased expectations for greater outcomes and services, some still argue the need for expanded learning time. It’s true that the research is mixed on this issue, in part because it’s not always about how much you have but how well you use it.
In Arizona, a full time student is defined in statute in terms of minimum instruction hours based on a 180-day school year (not counting recess, lunch, transition times between classes, etc.). To be clear, these instructional hours weren’t created to ensure that teachers had ample time to teach all of the standards expected of them or for students to have time to learn them. These hours were created to determine school funding and budgets.
In our most critical years, grades 1-3, students only spend 8 percent of their day receiving instruction in the following content areas: developmental reading, language arts, math, social studies, science, PE, art, music and health. This year, the pressure increased as Arizona implemented Move on When Reading, which requires schools to retain third-grade students that aren’t reading at grade level.
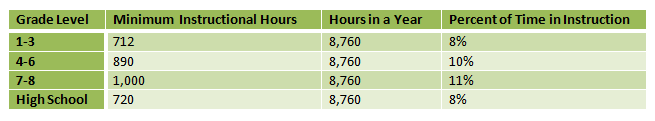
The table above presents the estimated time students spend in the classroom.* These instructional hours don’t reflect the increased rigor of Arizona’s College and Career Ready Standards or any of the other recent education reforms impacting schools.
Maybe it’s time that we ask ourselves some hard questions like: How much time does it take all students to learn what we’re asking of them? Do teachers have enough time to teach all of their students well? How much time does it take to accomplish our goals?
We suspect that the answers to those questions would increase instruction, costing far more money than what Arizona is paying now.
The table above presents the number of instructional hours expected by grade range, the total hours per year (taking 365 days and multiply by 24 hours/day) and the percentage of a students’ life they spent receiving instruction (instructional hours divided by total hours).