Association President Says it’s Time to Move Past Outdated Anti-Charter School Arguments
Twenty years ago, Microsoft released Windows ‘95, “The Rachel” haircut was hugely popular and Clueless sparked the youth fashion trend of tall socks and plaid skirts. Clearly, a lot has changed in the world of pop culture over the last two decades. Similarly outdated are the anti-charter school arguments from Apache Junction Superintendent Chad Wilson in hisMay 31 column inThe Arizona Republic.
Superintendent Wilson’s argument is a baseless, tired one made countless times in the 21 years since Arizona introduced charter schools. It also fosters an unproductive debate when it comes to meeting the true needs of Arizona schools, student and families today. In a nutshell, I’ll simply say this: Arizona charter schools are tuition-free and open to all. Our schools serve nearly 160,000 students from every ethnic and socio-economic category and with a multitude of needs, including special education.
Simply put, charter-school teachers and administrators are making minor miracles every day in this state and opening doors to a better future for countless Arizona children. We will never apologize for that, nor stand silent in the face of unwarranted, inaccurate allegations.
Arizona Governor Doug Ducey proposed a ballot initiative today that would inject $1.8 billion of new money into K-12 schools.
The measure, if approved by the legislature and voters in 2016, would direct additional money from the State Land Trust into Arizona’s public schools and students. TheGovernor’s office estimatesschools could access the new funds as early as fiscal year 2017.
“The Arizona Charter Schools Association applauds Governor Ducey for seeking a creative solution to bring an influx of additional dollars to improve education in Arizona’s public schools,” said Eileen B. Sigmund, President and CEO, Arizona Charter Schools Association. “As a state, we simply must do better when it comes to equipping our teachers and schools with the financial resources they need.”
The Arizona Legislature recently ended its 2015 session and one of the more significant pieces of education policy to emerge from it is the recognition of charter school “networks,” or groups of affiliated charter school organizations. In short, the Legislature has determined that charter schools that are part of a network should be treated as one organization, rather than individual entities, for the purpose of state funding. The result is that these charter school networks are funded similarly as traditional school districts.
Since 1994, Arizona has treated charter schools as independent entities, even if they are part of a larger group of charter schools. As a result, little information exists about the number of charter “networks” that exist or how large they are. The Association has combined information from the Arizona Department of Education with charter school affiliations collected by the Arizona Charter Schools Association to begin to fill the information gap.
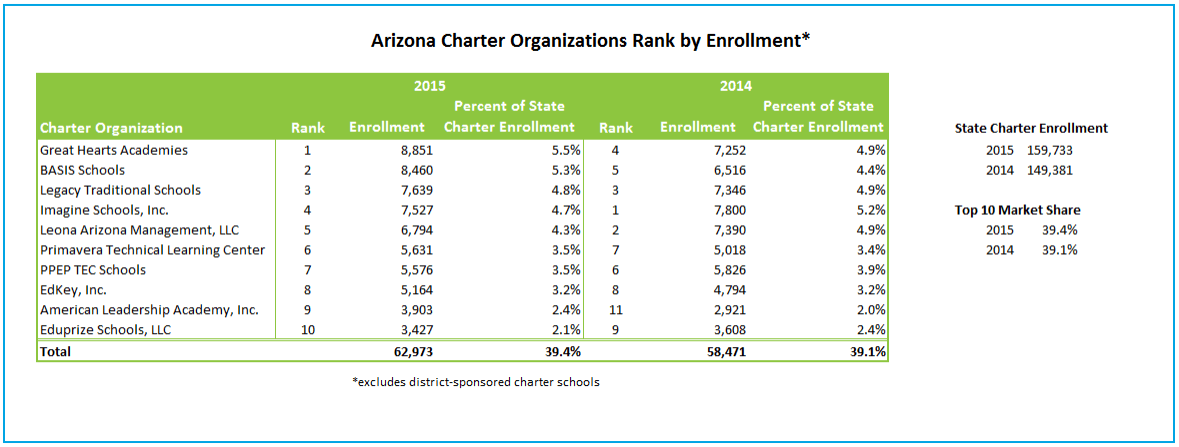
Taking this new view of charter schools, Arizona has 267 unique charter organizations, where some are networks of affiliated schools and others are a single school campus operating independent of any other school or charter organization. Combined, all charter organizations in the state enrolled nearly 150,000 students in 2014 and nearly 160,000 students in 2015, excluding district-sponsored charter schools.
Table 1 shows that in the last two years, the ten largest charter organizations — networks and single charter organizations — enrolled nearly 40 percent of all charter students. In 2015, the two largest organizations enrolled nearly 11 percent of charter students.
The table also shows the relative ranking of charter organizations based on their share of charter student enrollment. Nine out of ten charter organizations appear on both lists; however there is movement in the rankings. For example, Great Hearts Academies rose from fourth to first, while Imagine Schools dropped from first to fourth. These data demonstrate that eight out of the ten schools relative rankings shifted from 2014 to 2015, all but Legacy Traditional Schools and EdKey, Inc. This suggests that while there is a concentration of charter enrollment in the state’s largest charter organizations, enrollment patterns within this group varies.
It is unclear from these data the reasons why these networks are successful in enrolling a large proportion of the state’s charter students. However, these data provide an opportunity to ask questions about the types of schools parents are choosing to enroll their children. These charter organizations represent a variety of instructional models from back to basics to online, indicating that a large number of families are making enrollment choices across instructional methods. Additionally, the top three networks in the 2015 rankings represent schools that focus on academic rigor and college and career readiness through their unique instructional methods. Whereas, in the 2014 rankings, one of the top three networks, Leona Arizona Management, LLC, has diverse curriculum at its schools, including several that focus on students who have been unsuccessful in traditional settings.
These data also present additional policy and research questions for the future. How are the innovation, flexibility, and freedom from bureaucracy at the heart of the charter movement kept alive in these large charter organizations? If enrollment continues to concentrate in larger charter organizations, what is the future of the small, independent charter school? And most importantly, what does all this mean for students?
Part B Special Education Funding for Charter Schools
In 2014, the Association began investigating IDEA Part B funding for special education students after several charter schools raised concerns. Based on our research, 268 LEAs — district and charter — did not receive IDEA Part B Basic funding for their special education population, because according to the 1998 census they had no special education students.
Based on member feedback, we provided a webinar to help our schools understand how to get access to the Charter School Expansion Act (CSEA) grant, which is intended to address special education enrollment discrepancies
The IDEA Part B grant provides additional federal support for students based on a formula that considers the school’s 1) special education student enrollment, based on the 1998 Census, 2) the percent of the state’s poverty and 3) the percent of the state’s population. In this formula, the school’s special education enrollment receives the greatest funding at $513 per student; whereas the percentage of students in poverty and percentage of the population are funded at $29 and $91, respectively.
Charter schools that opened after 1998 or have experienced a significant increase in their special education enrollment are eligible to submit data to the Department through the Charter School Expansion Act (CSEA) grant. This grant is intended to address special education student enrollment discrepancies. Based on our research and findings, it is clear that charter schools need additional training and support regarding the CSEA and its ongoing use to make sure that they are receiving full funding for their special education students. This lack of training and support has resulted in significant underfunding to schools.
The Association used the 2015 IDEA Basic Entitlement data available online and merged estimated special education enrollment data from the AIMS testing file to determine the impact of special education students that are unaccounted for. This method is likely to result in a lower than expected number for each school because the AIMS data file only includes FAY special education students. Special education students in grades K-2, 9, 11 and 12 who aren’t retesting are excluded from this data. Regardless, this methodology resulted in 268 LEAs, district and charter, that did not receive IDEA Part B Basic funding for their special education population, because according to the 1998 census they had no special education students.
Therefore, these schools are only receiving IDEA Part B Basic funding for their percentage of state poverty and percentage of state population. Since each special education students’ (from the 1998 census) base level support is $513, these schools are being underfunded significantly. The total underfunding for these LEAs from IDEA Part B is $2,242,639.52. The true results, even given the likely underestimation, are staggering.
Once again, an Arizona charter school topped a prominent national ranking. U.S. News and World Report ranked BASIS Scottsdale first on its list of Arizona “Gold” schools. There were six schools on the list, including BASIS and two other charter schools.
Educating children often requires much more than quality instruction; most educators agree on the need to offer services that meet students’ social, emotional, and material needs if students are to succeed in the classroom[1]. Depending on the school, grade level, and student demographics, these additional needs can take the form of school counselors, social workers, before and after school programs, or parent outreach. Such services have been a part of the recent discussion around classroom vs. non-classroom spending.
Missing from the conversations about spending is an acknowledgement of the percentage of students in Arizona public schools who are living in poverty and as a result are more likely to need and benefit from “non-classroom” services. In the coming year, schools will likely face further reductions in budgets and increased pressure to “put more money in the classroom.” In order to provide some context and insight into the challenges facing Arizona public schools, the Association feels that it is beneficial to examine statewide trends in student poverty[2].
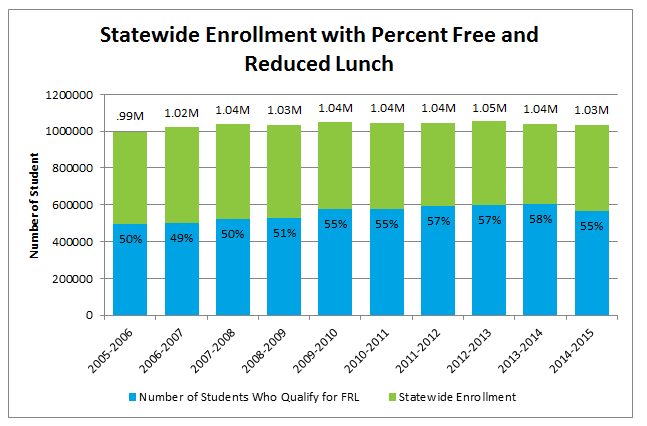
The graph presents statewide student enrollment in Arizona’s public schools and the number of students who qualified for free and reduced price lunch during the past 10 years[3]. As the graph shows, overall enrollment in Arizona public schools has fluctuated at just over one million students during this time. In comparison, the data indicate a steady increase in the percent of students eligible for free and reduced price lunch from 2007-2008 through 2013-14. In the most recent year, there is a slight decrease (-3%) reported.
The slight decrease in poverty in 2014-2015 may be an indicator of economic recovery and if it continues one would expect a decrease in the demand for student supports in schools as fewer families live in poverty. All other school spending being equal, one would expect a corresponding increase in the percent of funding that goes to the classroom.
The relationship between poverty and the percent of funding that goes inside or outside of the classroom is a research and policy question worth pursuing. The insights gained from this research can help policymakers understand the larger economic dynamics at work in Arizona’s public schools. These data may be useful in determining whether the percent of dollars spent outside of the classroom is a reflection of inefficiencies in the system, as it is often portrayed, or a reflection of the level of need in the student population. The Association believes that these data are important for policy makers to consider as they begin to better understand the context of school level expenditures.
Footnotes
[1] Moore, K.A., & Emig, C. (2014). Integrated student supports: A summary of the evidence base for policymakers. Bathesda, MD: Child Trends. Retrieved on 5/1/15 from http://www.childtrends.org/wp-content/uploads/2014/02/2014-05ISSWhitePaper3.pdf. [2] Data for this analysis were taken from the “Average Daily Membership” (ADM) and “Percentage of Children Approved for Free or Reduced-Price Lunches” files made publicly available by the Arizona Department of Education. [3] We acknowledge that eligibility for free and reduced price lunch is a proxy indicator of poverty and that there are limitations to its usefulness. Schools that do not participate in the National School Lunch Program do not have FRL data and there are a number of reasons why schools may not participate in the program. However, this does not mean that these schools do not enroll poor children. As a result, the numbers reported by the state should be considered conservative estimates.
Arizona Charter Schools Association President Eileen Sigmund appeared on Fox 10’s Newsmaker Sunday to discuss the biggest hurdles facing Arizona schools.
During a segment on Arizona Horizon, Arizona Charter Schools Association President Eileen Sigmund discussed how charter schools fared during the 2015 legislative session.
Over the last few months, we’ve brought you an analysis of Arizona’s public school tax credits, how they’ve changed from 2005-2013, and which schools benefit from them. Find our first blog here and our second blog here and our third blog here. For our final blog post on this topic, we will describe the types of programs that public school tax credits currently support. Our analysis uses 2013’s data which is the most recent year available from the Arizona Department of Revenue.
The law allows public school tax credits for extracurricular activities defined as “school sponsored activities that require enrolled students to pay a fee in order to participate including fees for band uniforms, equipment or uniforms for varsity athletic activities, and scientific laboratory materials [1].” In 1997, lawmakers expanded eligible programs to include “character education.” Character education programs must emphasize positive character traits like truthfulness, responsibility, compassion, diligence, and sincerity [2].
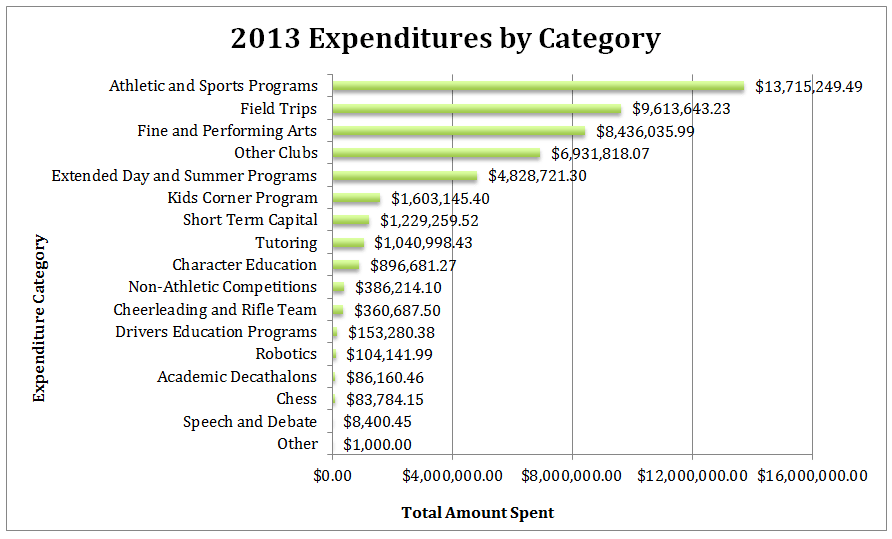
In 2013, Arizona public schools spent just under $50,000,000 of their tax credit donations, the largest portion of which was spent on sports and athletic programs ($13,715,249). The next largest expenditure categories were field trips ($9,613,643) and fine and performing arts ($8,436,035). Combined, these three categories comprised over 50% of tax credit expenditures in 2013 or just under $32,000,000.
Starting in 2011, as a temporary measure, public schools were allowed to use up to fifty percent of unencumbered contributions received on or before December 31, 2010 on short-term capital items such as textbooks, equipment, technology, library resources, instructional aids, and transportation vehicles. This provision expired on June 30, 2013.
Summary
Our previous analyses have shown that public school tax credit contributions continue to increase annually and that these contributions are increasingly benefiting more affluent students while donations at high-poverty schools have remained relatively low and stagnate over the last nine years. These expenditure data suggest that a significant amount of tax credit contributions are funding fee-based activities and a relatively small amount is funding character education or scientific laboratory materials, as the law suggests.
DATA AND METHODOLOGY
The primary data for this blog series consists of school-level tax credit amounts reported by schools for years 2005 through 2013. These files were obtained from the Arizona Department of Revenue [3] and include the total number of donations a school received, the total dollar amount received, and the total amount spent for each year. Additionally, for years 2011-2013, these files contain information about tax credit expenditures by category. To enhance our understanding of school-level characteristics, we linked the tax credit data to enrollment [4] and poverty data [5] obtained from the Arizona Department of Education.
The Department of Revenue collects data from each public school in the state and in most cases the data are reported for each school. In some cases, the data are reported as aggregated district amounts. For our analyses, we utilized all data reported, whether by district or by school, for all state summary tables and graphs. Where our analysis required school-level information, the district-level cases were omitted.
While the tax credit may be taken for either a general contribution or for fees, the Department of Revenue data does not draw a distinction. As a result, there is no way to know whether the amounts schools receive are donations that can be used at the discretion of the school, or whether they are in the form of fees that are, in practical terms, earmarked for a particular student.
For our expenditure analysis, we took each expenditure category listed in the tax credit file and summed them across schools to determine a statewide total expenditure by category. Because several categories listed in the tax credit file overlap (i.e. “sports” and “athletics”), we chose to combine them. These categories are athletic and sports programs, fine and performing arts, extended day and summer programs, cheerleading and rifle team, and driver’s education programs.
Footnotes/References
[1] Arizona State Legislature Private School Tuition; Tax Credit (E)A.R.S. § 43-1088 (1997) (December 1, 2014). [2] Arizona State Legislature Character Education Program Instruction; fundA.R.S. § 15-719 (December 1, 2014)
Our initial analysis of public school tax credits showed an increase in overall contributions during the nine years analyzed. Find our first blog here and our second blog here. The next question the Association sought to answer was which public schools have benefited from tax credits and to what extent.
In order to determine which public schools benefit from public school tax credit contributions, we looked at the variability in per pupil contributions across all schools. Figure 1 shows the relative size differences in per pupil tax credit contributions for schools in 2013, the most recent year these data were available.
FIGURE 1: Variation in Per Pupil Tax Credit Contributions to Schools, 2013
It is clear from this simple visual that the amount of tax credit contributions schools receive varies significantly. Some schools may receive little or no funding per pupil, while other schools receive hundreds of dollar per pupil in tax credit contributions.
What might account for these differences?
Public school tax credits are voluntary contributions made to schools by individual taxpayers. Schools rely largely on parents to make tax credit contributions, particularly if these are collected as fees for extra-curricular activities rather than general contributions to the school. They also rely on their communities and often promote on their websites, district newsletters or advertise in local media to get the word out about tax credit contributions. It is not unusual to see a solicitation on a community bulletin board or a movie theater screen prior to the feature. The success of these efforts will likely be dependent on the income level of parents and the local community.
In order to determine whether there is a relationship between a school’s level of poverty and the amount of contributions that a school receives, we linked the public school tax credit data to school-level percentage of students eligible for free or reduced-priced lunch (FRL) as part of the National School Lunch Program.
Although it is not without some limitations, percent FRL is the best available proxy for the level of poverty in an Arizona school. For this analysis, we divided schools into five categories:
Fewer than 25% FRL
25%-49% FRL
50%-74% FRL
75% or more FRL
No FRL data
FRL Data
It is important to note that the lack of FRL data does not mean that the school does not enroll students from low income families; it only means that the degree of poverty is unknown. Schools that do not participate in the National School Lunch Program do not have FRL data and there are a number of reasons why schools may not participate in the program.
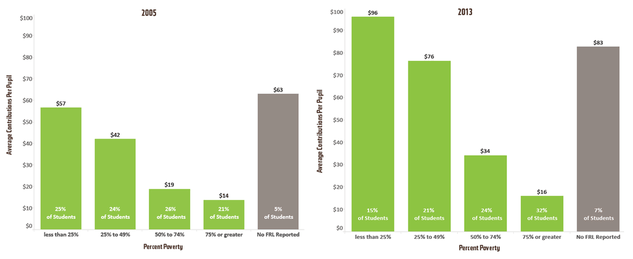
Table 2 shows the distribution of tax credit contributions for 2005 and 2013, broken out by level of poverty. For example, the bar at the far left represents the group of schools with fewer than 25% of students who qualify for free or reduced-priced lunches. This group of schools received, on average, $57 per pupil in 2005 and $96 per pupil in 2013. This same group of schools enrolled 25% of all students in the state in 2005 and 15% in 2013.
TABLE 2: Variation in Per Pupil Tax Credit Contributions to Schools, 2005 and 2013
Summary
The higher the concentration of poverty in the school, the less money it receives in public tax credit contributions. There is a clear pattern of decreasing contributions per pupil as the school’s poverty increases. In each year of the analysis, schools with less than 25% FRL received more contributions per pupil than all other groups of schools with FRL data. Schools with 25-49% FRL received the next largest amount of contributions, followed by the group of schools with 50-74% FRL, leaving the least amount of contributions to the group of schools with 75% or more FRL.The disparity in tax credit contributions between high-poverty and low-poverty schools is significant and growing. While all groups of schools saw an increase from 2005 to 2013 in the per pupil contributions they received, not all groups saw contributions grow at the same rate. The schools with the highest rates of poverty (75% or more) saw the smallest increase of all groups at only 14%, or $2 per pupil. The schools with the lowest rates of poverty (less than 25%) saw an increase of 68%, or $39 per pupil. Schools in the 25%-49% FRL range saw an increase of 80%, or $34 and schools in the 50%-74% FRL range saw an increase of 79%, or $15. Measured in total dollars or percent increase, the schools with the highest concentrations of poverty saw the smallest increase in contributions during the nine years we examined. In 2005, schools with the lowest rates of poverty received contributions per pupil that were approximately four times as much as schools with the highest rates of poverty ($56 vs. $14). In 2013, this gap has grown to six times the amount ($96 vs. $16). The relative difference between schools that have less than 50% FRL and more than 50% FRL is also significant; the average contribution per pupil amount is nearly half ($76 vs. $34 in 2013 ) once the school reaches 50% FRL.
This is Part I of the Association’s four-part series on Tax Credits. Find Part I here, Part II here, and Part IV here.
DATA AND METHODOLOGY
The primary data for this blog series consists of school-level tax credit amounts reported by schools for years 2005 through 2013. These files were obtained from the Arizona Department of Revenue [1] and include the total number of donations a school received, the total dollar amount received, and the total amount spent for each year. Additionally, for years 2011-2013, these files contain information about tax credit expenditures by category. To enhance our understanding of school-level characteristics, we linked the tax credit data to enrollment [2] and poverty data [3] obtained from the Arizona Department of Education.
The Department of Revenue collects data from each public school in the state and in most cases the data are reported for each school. In some cases, the data are reported as aggregated district amounts. For our analyses, we utilized all data reported, whether by district or by school, for all state summary tables and graphs. Where our analysis required school-level information, the district-level cases were omitted.
While the tax credit may be taken for either a general contribution or for fees, the Department of Revenue data does not draw a distinction. As a result, there is no way to know whether the amounts schools receive are donations that can be used at the discretion of the school, or whether they are in the form of fees that are, in practical terms, earmarked for a particular student.
For our expenditure analysis, we took each expenditure category listed in the tax credit file and summed them across schools to determine a statewide total expenditure by category. Because several categories listed in the tax credit file overlap (i.e. “sports” and “athletics”), we chose to combine them. These categories are athletic and sports programs, fine and performing arts, extended day and summer programs, cheerleading and rifle team, and driver’s education programs.
 Twenty years ago, Microsoft released Windows ‘95, “The Rachel” haircut was hugely popular and Clueless sparked the youth fashion trend of tall socks and plaid skirts. Clearly, a lot has changed in the world of pop culture over the last two decades. Similarly outdated are the anti-charter school arguments from Apache Junction Superintendent Chad Wilson in his May 31 column in The Arizona Republic.