Categories
Association Blog

Charters at the Capitol

Join us for our second annual Charters at the Capitol on Wednesday, March 2. This day of advocacy connects charter school leaders with lawmakers, showing the strength of Arizona’s robust charter school movement. With one of the highest percentages of students attending a public charter school, Arizona continues to lead the nation in charter school growth. Fully, about 30 percent of the state’s public schools are charter schools, and about 15 percent of our public students attend a charter.

We plan to set individual meetings with lawmakers throughout the morning, and then join together to attend the House Education Committee meeting in the afternoon. Sign up below and we will follow up to schedule appointments.

Have your voices heard at the Capitol!

Categories
Association Blog

Charter Association Commends Governor for Continued K-12 Support

The Arizona Charter Schools Association released a statement today expressing support for the proposals outlined in Gov. Doug Ducey’s State of the State address.

“On behalf of the Arizona Charter Schools Association, I commend Governor Ducey for his continued commitment to Arizona schools and K-12 education.

Categories
Association Blog Charters Changing Lives

Arizona Charters Academically Exceeding in 2015

Arizona is home to 556 charter schools serving 170,755 students, representing 30 percent of schools and 15 percent of students in the 2015-16 school year. Charter schools are public schools that are innovative while still being held accountable for improved student achievement. Arizona laws provide public charter schools more autonomy in exchange for greater accountability for improved student achievement.

NAEP

Recent data indicate that Arizona’s charter students outperformed nearly every other state on the 2015 National Assessment of Educational Progress. On eighth grade mathematics, for instance, Arizona charter students scored in a statistical dead heat with Massachusetts, the highest scoring of the 50 states.

NAEP Infographic

Categories
Education Blog

Special Education Student Enrollment Patterns – SPED Series, Part III

In this third installment of our series of special education funding blogs, we sought to better understand the enrollment patterns of special education students across Arizona.  We learned the enrollment of special education students varies widely across counties and within and between districts and charter schools in Arizona, especially when severity of special education disabilities is taken into account.  It is important to note, though, that the Group A portion of the school funding formula (see Blog Part II) assumes a relatively even distribution of special education students across the state. Our research  suggests parents of students with special needs seek out communities (counties or school districts and charters) where services best match their student’s needs.

To understand the enrollment patterns of our special education students, we calculated two indicators that provide insight into the distribution of students with special needs across different public schools, and the severity of their disabilities. The two measures we analyzed are:

Percent Special Education—this is the proportion of students enrolled in the district or charter who are identified as requiring special education services. This measure allows us to compare the concentration of special education students across districts and charters.

  • [special education students] ÷ [total enrollment]

Percent Weighted Special Education—this is the proportion of special education students enrolled in the district or charter, multiplied by the each student’s funding weight. The greater the weight, the more severe the disability. For example, one (1.0) special education student with a weight of 7.947 (multiple disabilities with severe sensory impairment) is equal to a weighted student count of 7.947.  This measure allows us to compare the severity of special education population across schools.

  • Σ[special education students x funding weight] ÷ [total enrollment]

Table 1 below shows the percent of special education students and the percent of weighted special education students for each county in Arizona.

La Paz County’s percent special education is the highest of all counties (16.5%), indicating it has the largest proportion of student identified as needing special services. However, once the severity of the disability categories are taken into account, the percent weighted special education is 9.7%, which places it in the middle of the pack.

The counties with the lowest percent of weighted special education students are also some of the least populated counties in the state: Santa Cruz, Greenlee, Graham, etc. This suggests that families whose special education needs are more intensive seek schools in more populated counties, with larger school districts better positioned to provide services. Maricopa County, the largest county in the state, is also the county with the highest percent of weighted special education students (11.2%).

Table 2 shows the same information for the fifteen largest school districts in the state.

The percent of special education students ranges from 7.6% to 14.9%, showing differences in the concentration of special education students across the largest school districts. When the severity of disabilities is taken into account, the range grows from 6.6% to 15.6%. Tucson Unified and Washington Elementary provide a good example of the shift: they both have 14.9% special education students (the highest of all the big districts), but their percent weighted special education are 11.7% and 13.6% respectively, suggesting that, in general, the needs of the special education population in Washington Elementary are more severe than those of students in Tucson Unified.

Table 3 shows the information for the state’s largest charter organizations.

The percent of special education students ranges from 1.8% to 12.6%. When the severity of disability categories is taken into account, the range widens further: from 1.1% to 15.1%. Overall, the rates of both special education and weighted special education are lower than those of school districts, but the wider range reflects the more specialized approach of some charter schools, including those that set out to serve primarily special education students.

Table 4 shows the information for the fifteen districts and charters with the highest percentages of weighted special education students.

In this case, the percent of special education students ranges from 17.1% to 100%, but once the severity of the disabilities are taken into consideration, the percent of weighted special education students ranges from 33.6% to 543.1%. Arizona Autism Charter School and Sequoia School for the Deaf and Hard of Hearing, part of the EdKey schools in Table 3, enroll only special education students and the corresponding weights of those disabilities result in percent weighted special education numbers well over 500%.

These data, coupled with the nature of charters, suggests that the charter schools on this list have specifically sought to serve special education students. It is unclear, using only these data, whether the same holds for the districts on the list.  Double Adobe, Ash Creek, Yarnell, and Kirkland districts are all small, have a relatively high percent of special education students and when the severity of the disabilities is taken into account, the percent of weighted special education students is even higher.

While our analyses show the enrollment of special education students varies widely, the data suggests that parents of students with special needs seek out communities (counties or school districts and charters) where services best match their student’s needs. Without a relatively even distribution of special education students across Arizona, special education funding must be reviewed and updated, particularly for those districts and charters that are serving a greater proportion of special education and weighted special education students.

This is the third blog in our Special Education Funding series. Click here to read part 1, and click here to read part 2.

Categories
In the News

Politics in the Yard with Association President Eileen Sigmund

Association President and CEO Eileen Sigmund appeared on the CW6’s Politics in the Yard with Jaime Molera in December. The new political talk show discusses Arizona issues with a CW6 twist. The fast-paced, fun and entertaining weekly show appears on Sunday nights at 7 p.m. on the CW6.

Jaime and his guests talk politics with the biggest leaders in Arizona, play side-splitting games and have a few laughs, turning political talk on its head.

Categories
In the News

20 Years of Arizona Charter Schools

Arizona’s charter schools have continued to thrive after 20 years, with charter students consistently outperforming their peers on state and national tests. The Cronkite News Service interviewed Association President and CEO Eileen Sigmund and leaders from some the state’s best schools, who explained why school choice is an important piece of the education landscape.

Categories
In the News

Arizona Excels at School Choice

Arizona does many things well, including school choice, according to an Arizona Republic year-in-review column that ran last month. School choice was among eight items listed as the Arizona’s biggest strengths and reasons we stand out from other states.

The article calls Arizona a “leader” in the charter school movement, noting that the concept of school choice is still a novelty in many other states. More work needs to be done to equitably fund public schools and serve poorer students, but the state’s progress is undeniable.

Categories
Association Blog Charters Changing Lives

More Charter Seats Opening for Arizona Students

Arizona has paved the way for nearly a dozen new charter schools as the state continues to meet the needs of Arizona students and families.

The 11 new schools, set to open in August 2016 and August 2017, were approved by the Arizona State Board for Charter Schools on Monday. Once built out, these schools have the capacity to serve an additional 9,000 students.

Categories
Association Blog

Classrooms First Council Seeks Extension

The Classrooms First Initiative Council met Wednesday, Dec. 2 to unveil its final recommendations for reforming Arizona’s outdated school finance system to Governor Doug Ducey.

The Council shared 17 findings, including three additional recommendations, on what was needed to improve school finance.

Categories
Education Blog

Special Education Simplified – SPED Series, Part II

As Arizona’s K-12 enrollment has grown, including students with disabilities, our school finance formula has stayed relatively unchanged. It has not fully addressed recommendations made in a 2007 special education cost study[1] nor has it kept pace with the 5 percent increase in our special education population, as we found in our first blog. The Association investigated the current funding formula to understand how special education students are funded and how the funding mechanism is impacted by increases in student enrollment  in order to determine whether it serves the needs of our special education students.

Arizona’s school funding formula addresses special education funding using two separate mechanisms. The first funding mechanism, called Group A[2], provides funding for every student in the state, regardless of special education designation. This portion of funding is designated for a particular group of special education students as well as other programs like gifted, career exploration, and remediation programs. Group A funding is distributed to all schools based on the total student enrollment; each student receives an identical weight in the funding calculation. The second funding mechanism, called Group B[3], provides funding according to the most severe special education category identified in students’ Individual Education Plans. The Group B categories and their definitions are presented in the following table:

The Findings

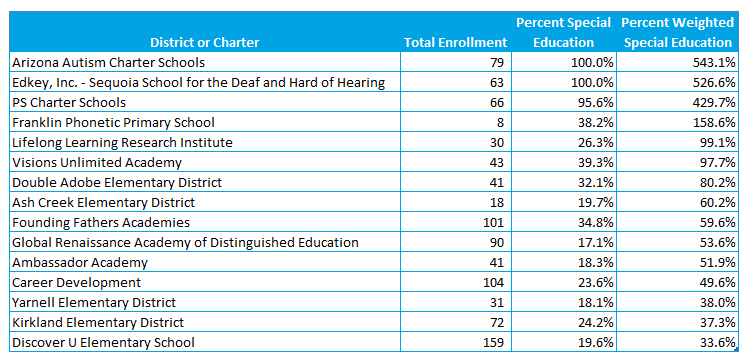
Like the overall system, these two funding mechanisms are directly impacted by total population growth (Group A) and special education population growth (Group B). The Association set out to analyze the current special education enrollment and funding data to determine how these dollars are allocated within the designated categories.

According to the FY15 school finance data[4], Arizona has 121,602 identified special education students, representing 11 percent of the state’s student population.  The distribution of students by special education category – Group B designation – is presented in the following table in order of severity (least to greatest) and their relative funding weights (lowest to highest). The student count represents the total number of identified students, based on their Individual Education Plan. The weight identifies the multiplier that is used in the funding formula found in A.R.S. § 15-943; each category has an associated weight. This multiplier generates the weighted student count, which is then multiplied by the base funding level of $3,373.11 for most charters and $3,415.27 for most districts. The associated funding levels by category and per pupil allocations are a result of the funding formula.

This shows 84 percent (102,142) of the state’s special education population are identified as having emotional disabilities, mild intellectual or learning disabilities, speech impairments and other health impairments. This group of students is funded by both the Group A and Group B portions of the formula.  As evidenced in the table, the small funding weight (.003), results in a weighted student count of 306 students.  In other words, this large group (102,142) is funded as if there were only a small number of students (306) in the state with these characteristics. The result is a per pupil amount of $10.24, in addition to Group A funding.

The remaining 16 percent of special education students (19,460) are funded as significantly higher weights given their designations.  Students diagnosed with multiple disabilities and severe sensory impairments (MD-SSI) are identified as the most significantly impacted group and therefore receive the highest funding weight.  As evidenced in the table, the large funding weight (7.947), results in a weighted student count of 6,008 students.  In other words, this small group (756) is funded as if there were a large number (6,008) in the state with these characteristics.  The result is a per pupil amount of $27,149.88.

While $10,781 to $27,149 may seem like a lot of money for each special education student, the implementation of the current funding formula lacks an understanding of the needs, and recent estimates of the actual costs of serving special education students.  The 2007 cost study recommended both increases to the Group A and Group B weights to account for the expenses incurred to support students’ needs.  However, we know that the needs identified in 2007 have not been properly addressed and it’s likely that these needs have changed in the last eight years. Policy makers should consider the current categories and funding weights as they make recommendations for future modifications.

This is Part II in the Association’s series on Special Education funding. Read Part I here and Part III here.

Footnotes/References
[1] Special Education Cost Study at: http://www.azed.gov/specialeducation/files/2011/06/specialeducationcoststudy2007.pdf
[2] “Group A” means educational programs for career exploration, a specific learning disability, an emotional disability, a mild intellectual disability, remedial education, a speech/language impairment, developmental delay, homebound, bilingual, other health impairments and gifted pupils pursuant to A.R.S. § 15-752.
[3] “Group B” means educational improvements for pupils in kindergarten programs and grades one through three, educational programs for autism, a hearing impairment, a moderate intellectual disability, multiple disabilities, multiple disabilities with severe sensory impairment, orthopedic impairments, preschool severe delay, a severe intellectual disability and emotional disabilities for school age pupils enrolled in private special education programs or in school district programs for children with severe disabilities or visual impairment and English learners enrolled in a program to promote English language proficiency pursuant to A.R.S. § 15-752.
[4] Special education funding data were used for this analysis, specifically student counts that are used for the calculation of the state equalization formula for fiscal year 2015. Student counts are provided by each Local Education Agency (LEA) to the Arizona Department of Education (ADE) and can be found in LEAs’ individual APOR (districts) and CHAR (charters) reports. Student counts are found at: http://www.ade.az.gov/Districts/EntitySelection.asp. It is necessary to download reports one LEA a time.