Categories
Education Blog

A FIRST LOOK AT AzMERIT: MORE TEST RESULTS THAN STUDENTS

Arizona’s new state test, AzMERIT, shifts high school testing from a tenth grade exam to end-of-course assessments in grades nine through eleven.  This shift presents new challenges and opportunities for policy makers to consider when building a state accountability system. These dynamics will likely play out in a variety of ways when calculating percent passing and percentage tested. It will be important for policy makers to understand the potential impacts prior to the development of any accountability system.

What’s the Big Deal?

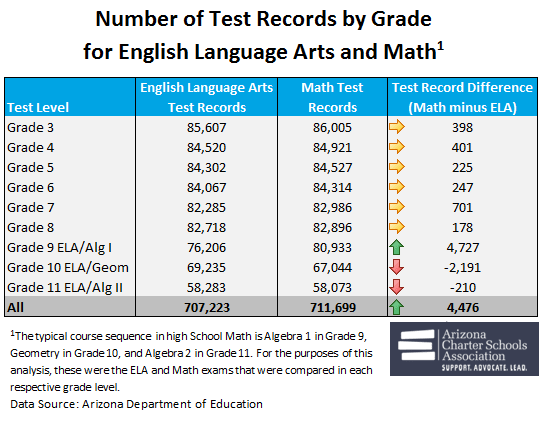
With the passage of SB1430 the State Board of Education will begin to develop its A-F methodology.  The cornerstone to any state accountability system is student level test scores that are used to calculate passing rates and growth scores.  In preparation for this work, the Association began analyzing the 2015 AzMERIT data and discovered significant differences in the number of test records between English Language Arts (ELA) and Math, especially at the high school level.  Given the importance of these data, we set out to investigate the causes and understand the impact. Table 1 shows the number of test records for ELA and Math for each grade level.  At nearly every grade level, the number of Math test records is greater than those for ELA.

The greatest difference is in Grade 9, where most students take an ELA test and, typically, Algebra I. In 2015, the nearly 5,000 more Algebra I test records than Grade 9 ELA test records suggest that students other than high school freshmen are taking Algebra I.
In order to understand the effect of these results, the Association evaluated them in context to the overall enrollment by grade. Table 2 presents grade-level enrollment and a calculation of the percent tested within each content area, as a point of reference.  These data are also reported out by district and charter schools in order to identify any potential differences by type of school.Table 2: 

The use of October enrollment, the only publicly available enrollment file, may impact the “percentage tested” calculations; it is unclear how enrollment changes closer to the testing window could affect these results.  These data show that for almost all elementary grades (grades 3-8), test records account for 99 to 100 percent of grade level enrollment.  Until Grade 8, no compelling difference exists between district and charter schools. However, in Grade 8, math test records account for only 96 percent of grade level enrollment for charter school students, while district schools test 99 percent.

The significant pattern changes that can be seen in the high school “percent tested” columns suggest that the guidance from the Assessment and Accountability divisions within the Department were either unclear or, at best, left room for interpretation.  It would appear that district and charter schools implemented the guidance from the Department regarding end-of-course exams very differently; with large differences in percent testing between the types of schools.  These data also suggest that districts and charters had differing interpretations of the guidance regarding which students must test for each of the end-of-course assessments.

Several examples of this can be seen throughout high school testing.  For example, Grade 9 ELA test records account for 104 percent of Grade 9 enrollment in charter schools and 88 percent of Grade 9 enrollment in district schools. Algebra I test records in math account for 130 percent of Grade 9 enrollment in charter schools and 92 percent of Grade 9 enrollment in district schools.  This suggests that district schools have significantly fewer freshmen taking the Grade 9 ELA test than taking the Algebra I test, and that charter schools are likely testing grades other than freshmen in these courses, particularly Algebra I.  This could be the result of the significant number of alternative charter high schools that serve over-age, credit deficient student populations. The October enrollment file shows 118 alternative charter schools serving Grade 9 students.

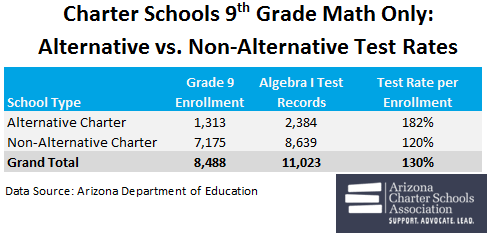
In order to investigate this further, the Association evaluated the percentage of ninth grade students tested within charter schools by comparing alternative charter high schools to all other charter high schools.  The results shown in Table 3 suggest alternative charter school students are taking the Algebra I exam beyond Grade 9, and are likely taking multiple end-of-course exams in a given year. This finding is consistent with the student population enrolled in alternative schools and likely explains a significant portion of the overall difference between charter and district schools.

Table 3:

WHY IS THIS IMPORTANT?

These results suggest that guidance from multiple divisions within the Arizona Department of Education resulted in districts and charters making choices about which students should be tested and with which test they should be given.  Without clear policies regarding test taking and the use of test scores for school accountability, the technical validity and overall fairness of any accountability system may be jeopardized.

As state policy makers begin to consider the components and methodology that will be used to calculate A-F and federal accountability formulas, it will be important to understand the impact of end-of-course assessments on availability of data and its use. Unlike the previous state assessment, AzMERIT and the use of end-of-course assessments significantly increases the complexity of available testing data.  These new data need to be fully understood prior to their use for high stakes decisions.

Policy makers should focus on the following areas for consideration: understanding the requirements for end -of-course exam administration and how they impact testing; determine how multiple scores associated with individual students will be used in accountability decisions i.e., calculation of percentage passing; determine how a greater than 100% tested rate will impact accountability decisions.  With each of these areas, clear and timely guidance to the field will be necessary to ensure that schools are not adversely impacted by their testing decisions.  Without this, the foundation of our state’s accountability system (the test score) will be under scrutiny and the reliability and validity of the overall rating will be suspect.

Categories
Education Blog

The Disconnect Between Student Funding and School Letter Grades

School finance has been the topic of lively debate in Arizona, recently.  Parents, school leaders, and politicians from both political parties have openly expressed their concern over years of budget cuts, while newspapers continue to report school funding as a major concern of educators, expressed at the Superintendent’s “We Are Listening” tour.  Add to that a recent report by the U.S. Census Bureau that ranks Arizona at or near the bottom in per pupil spending, and it’s clear that school funding is an issue that needs to be addressed.

Although recent discussions about school funding would make it seem that urgent reform is needed, data reported from the Arizona Department of Education earlier this year paints a different picture.  Every year, the Department assigns letter grades to public schools based on a combination of their students’ performance on standardized tests and academic growth.  Although these grades are not perfect measures of school quality, they offer insight into how a school is serving its students.  When school letter grades were released to the public last August, education advocates were pleased to announce that schools were not only doing well, but that they had improved from the previous year.  Our analysis showed that that 61 percent of public schools received an A or B rating and that nearly 70 percent of public school students attended an A or B rated school.  Looking at these statistics, it seems that Arizona’s public schools are doing quite well.

Taken together, the fact that Arizona ranks at or near the bottom in per pupil spending at the same time it enrolls 70 percent of its students in A and B rated schools may be seen as an argument against increasing school funding.  In fact, these data could be interpreted to indicate that perhaps Arizona public schools are fine just the way they are.

We believe, however, that this is not the case. As we’ve written previously, Arizona’s school letter grades are not reflective of the true state of education in Arizona.  This is problematic for school funding and education reform advocates because, by our state’s own measures, Arizona schools appear to be doing well despite years of budget cuts.  However, consider the fact that in 2013, Arizona ranked 42nd in fourth-grade reading scores and 22nd in fourth-grade math scores on the National Assessment of Educational Progress.   Also, roughly 44 percent of high school graduates do not enroll in post-secondary institutions upon graduation and only 19 percent receive a diploma from a four-year institution six years after graduating from high school.  These data surely paint a very different picture of school performance.  It is plausible to assume that in order for Arizona to improve on these external measures of student performance, schools will need additional resources.  As the old adage states: the definition of insanity is doing the same thing over again and expecting a different result.

So then, if we believe that our schools are likely to require more resources then we must be clear about student outcomes.  This is not to diminish the work of teachers, principals, and students at A and B rated schools.  Earning these labels requires significant effort and should be commended.  However, we must also acknowledge that earning an A or B, in a system that essentially norms public school performance, does not mean that students are college and career ready.  If Arizona students are to receive the education that they deserve, then we must do more to provide them with access to rigorous curricula, excellent teachers, and resources that will prepare them to be happy and productive citizens in the 21st Century.  Doing this, however, costs money.

In the coming months, policy makers, educators and business leaders plan to address some of the state’s most pressing education issues. The Governor’s Classrooms First Initiative Council is faced with the daunting task of school finance reform.  At the same time, the Arizona State Board of Education and the Department of Education will begin redesigning A-F letter grades.

The Association will play an active role as technical advisors on both issues. As we advocate for increased funding for students, we will also be clear to decision makers that Arizona students deserve better schools.

Categories
Education Blog

Quality Seats in Arizona Increasing Over Time

The Association believes education leads to opportunities in life, and we work hard to make data transparent and actionable. As we look at Arizona’s A-F accountability system, we are asking whether our students are in quality seats.

For our purposes, a student is enrolled in a quality seat if they attend a Tier I school (A or B rating).  At the end of the day, we want to be able to measure the change in the number of quality public school seats available for students across Arizona — district and charter.

As the Association has pointed out in several of our publications, the relationship between poverty and measures of student achievement has long been a limitation of measurement of student achievement in education. The challenge for Arizona’s accountability model is to adequately control for the effect of poverty on the final school rating. As we noted in our publications, despite the inclusion of the student growth percentiles, the A-F model still has limited use in portraying school quality due to its failure to adequately control for the effects of poverty and fairly measure a school’s contribution to learning. However, all those issues notwithstanding, we still believe analyzing these data will provide insight into Arizona’s current accountability system.

A-F data published by the Arizona Department of Education in August indicates an overall increase in the percentage of A and B rated schools, with nearly 2 out of 3 schools achieving these results (62 percent of schools were rated A or B in the traditional model). To put this number in context, in 2012 54 percent of schools were rated A or B, in the traditional model. While it’s important to see the numbers of schools improving, we wanted to take a closer look at the number of students impacted by these improved letter grades.  In order to do this we designated each school into one of three tiers based on their A-F letter grade. Tier I represents all schools receiving an A or B rating; Tier 2 are C rated schools, and Tier 3 are schools earning a D or F rating.

We analyzed the data from the past three years of A-F accountability results to evaluate the trends in the number of quality seats. The following tables present the data for all public schools — district and charter — in each of the past three years. The number of students and the percentage of their enrollment is reported annually. The data show, as expected given the overall increase in the number of A and B rated schools, a larger number of students are enrolled in a quality seat in 2014 (69 percent) as compared to 2012 (62 percent).  As the number of Tier 1 seats increased, the number of Tier 2 and Tier 3 seats decreased, demonstrating an overall improvement in the number of seats available across Arizona. However, an alarming number of seats are not rated in 2014, more than double the number in 2013. It should be noted that the Arizona Department of Education has not yet finalized the “pending” schools which account for a large number of these seats without data.

These data present an alternative lens to evaluate the impact of Arizona’s school accountability measure.  Certainly, these results are affected by countless school improvement decisions at the classroom, school, LEA and state level (including the work of the Arizona State Board for Charter Schools).  No matter the decisions being made, these data make it clear that, at least according to our A-F results, more of our students are enrolled in a quality seat now than in 2012 when we started.